R: Visualizes and calculates strong and weak genotypes.
plotAndCalculateWeakAndStrongGenotype
R Documentation
Visualizes and calculates strong and weak genotypes.
Description
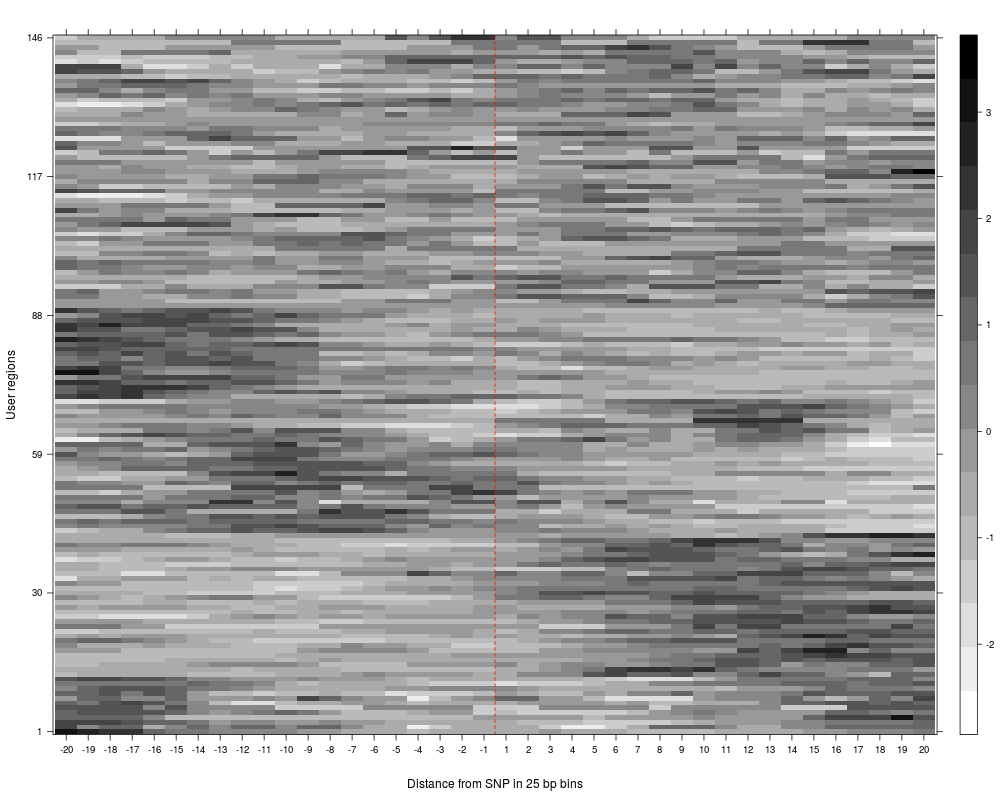
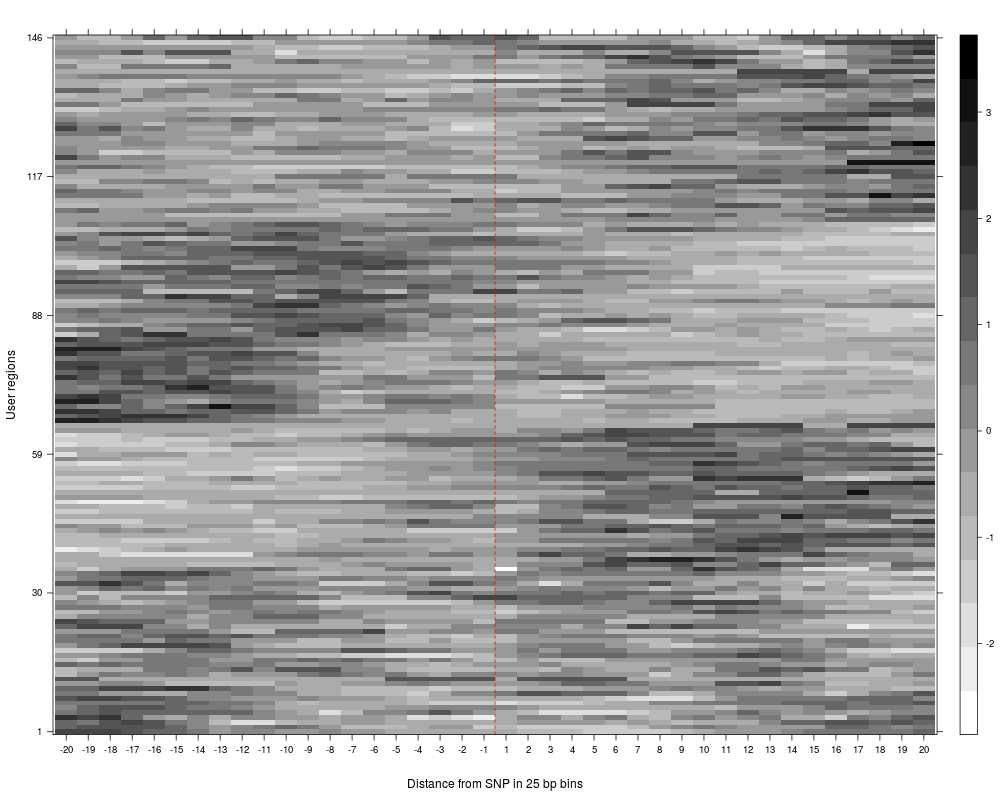
The function plotAndCalculateWeakAndStrongGenotype finds the strongest and weakest genotypes based on reads extracted around each region. Strong and weak genotypes are found using the reads extracted from SNPhood and their corresponding genotypes as found by the function associateGenotypes
Note the reads have to be merged using the function mergeReadGroups before running this function.
Logical(1). Default TRUE. Should a normalization be done on the counts/enrichments values before clustering? If set to TRUE,
a normalization procedure based on subtracting the mean dividing by standard deviation for each region is performed. For more details, see the
vignette.
nClustersVec
Numeric. Default 2. The number of clusters the data should be divided into. This can either be a vector or a single value. if multiple clusters are specified, multiple clustering analyses will be performed and for each of them, a plot is produced. make sure to specify the parameter fileToPlot in that case; otherwise, only the last plot may be visible.
fileToPlot
Character(1) or NULL. Default NULL.
Filename of the PDF file for the output plots.
If set to NULL, plots will be plotted to the currently active device.
verbose
Logical(1). Default FALSE. Should the verbose mode (i.e., diagnostic messages during execution of the script) be enabled?
Value
Modified SNPhood object with the results of the analysis stored in the object.
Specifically, a matrix for average reads per SNP for datasets which have strong and weak genotypes, respectively, are stored in the
slot additionalResults$genotype.
The SNPs which have invariant genotypes across all the samples being analyzed are also saved.
In addition, clustering on the strong and weak genotype read mateices are reportd as in the function plotAndClusterMatrix.
R version 3.3.1 (2016-06-21) -- "Bug in Your Hair"
Copyright (C) 2016 The R Foundation for Statistical Computing
Platform: x86_64-pc-linux-gnu (64-bit)

R is free software and comes with ABSOLUTELY NO WARRANTY.
You are welcome to redistribute it under certain conditions.
Type 'license()' or 'licence()' for distribution details.

R is a collaborative project with many contributors.
Type 'contributors()' for more information and
'citation()' on how to cite R or R packages in publications.

Type 'demo()' for some demos, 'help()' for on-line help, or
'help.start()' for an HTML browser interface to help.
Type 'q()' to quit R.

> library(SNPhood)
Loading required package: GenomicRanges
Loading required package: BiocGenerics
Loading required package: parallel

Attaching package: 'BiocGenerics'

The following objects are masked from 'package:parallel':

    clusterApply, clusterApplyLB, clusterCall, clusterEvalQ,
    clusterExport, clusterMap, parApply, parCapply, parLapply,
    parLapplyLB, parRapply, parSapply, parSapplyLB

The following objects are masked from 'package:stats':

    IQR, mad, xtabs

The following objects are masked from 'package:base':

    Filter, Find, Map, Position, Reduce, anyDuplicated, append,
    as.data.frame, cbind, colnames, do.call, duplicated, eval, evalq,
    get, grep, grepl, intersect, is.unsorted, lapply, lengths, mapply,
    match, mget, order, paste, pmax, pmax.int, pmin, pmin.int, rank,
    rbind, rownames, sapply, setdiff, sort, table, tapply, union,
    unique, unsplit

Loading required package: S4Vectors
Loading required package: stats4

Attaching package: 'S4Vectors'

The following objects are masked from 'package:base':

    colMeans, colSums, expand.grid, rowMeans, rowSums

Loading required package: IRanges
Loading required package: GenomeInfoDb
Loading required package: Rsamtools
Loading required package: Biostrings
Loading required package: XVector
Loading required package: data.table

Attaching package: 'data.table'

The following object is masked from 'package:GenomicRanges':

    shift

The following object is masked from 'package:IRanges':

    shift

Loading required package: checkmate

------------------------------------------------------------------------------------------------------------------
|       Welcome to the SNPhood package and thank you for using our software. This is SNPhood version 1.2.2.      |
| See the vignettes (type browseVignettes("SNPhood") or the help pages for how to use SNPhood for your analyses. |
|       Thank you for using our software. Please do not hesitate to contact us if there are any questions.       |
------------------------------------------------------------------------------------------------------------------

> png(filename="/home/ddbj/snapshot/RGM3/R_BC/result/SNPhood/plotAndCalculateWeakAndStrongGenotype.Rd_%03d_medium.png", width=480, height=480)
> ### Name: plotAndCalculateWeakAndStrongGenotype
> ### Title: Visualizes and calculates strong and weak genotypes.
> ### Aliases: plotAndCalculateWeakAndStrongGenotype
>
> ### ** Examples
>
> data(SNPhood.o, package="SNPhood")
> SNPhood_merged.o = mergeReadGroups(SNPhood.o)
Check object integrity and validity. For large objects, this may take some time. Use the function changeObjectIntegrityChecking to disable this check for the object.
> SNPhood_merged.o = plotAndCalculateWeakAndStrongGenotype(SNPhood_merged.o, nClustersVec = 6)
[[1]]

[[1]]

> SNPhood_merged.o = plotAndCalculateWeakAndStrongGenotype(SNPhood_merged.o, nClustersVec = 2:6, verbose = FALSE)
[[1]]

[[1]]

>
>
>
>
>
> dev.off()
null device
          1
>
 .
.