R: Clustering of read counts or enrichmens across bins for a...
plotAndClusterMatrix
R Documentation
Clustering of read counts or enrichmens across bins for a specific dataset and read group
Description
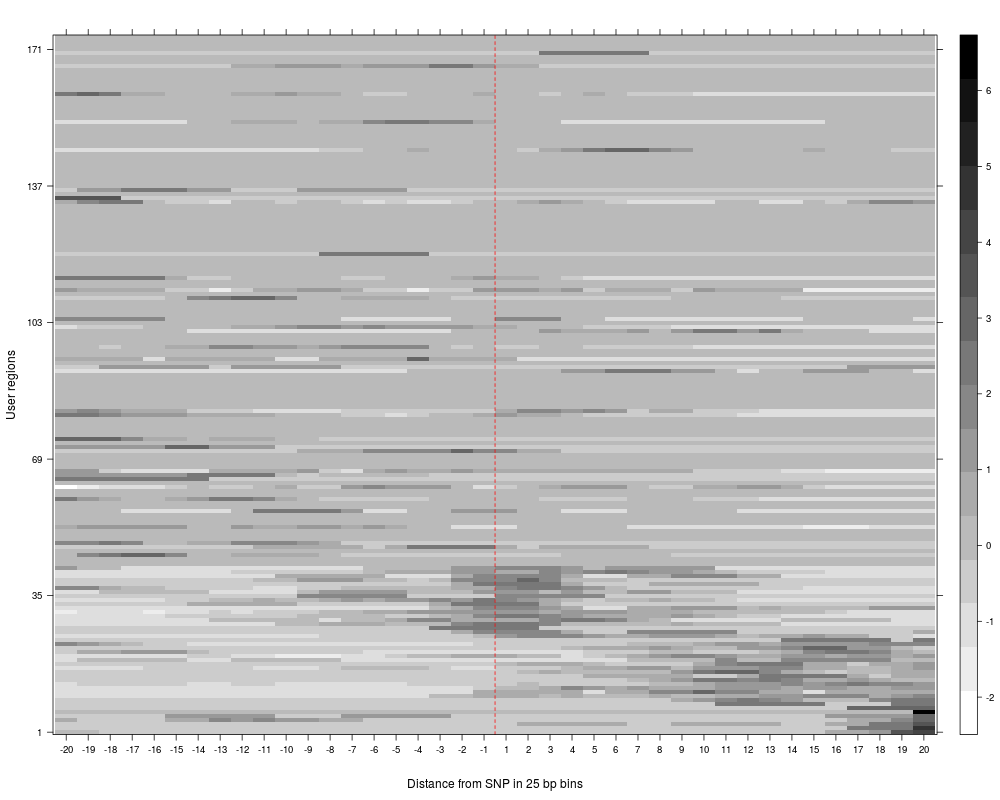
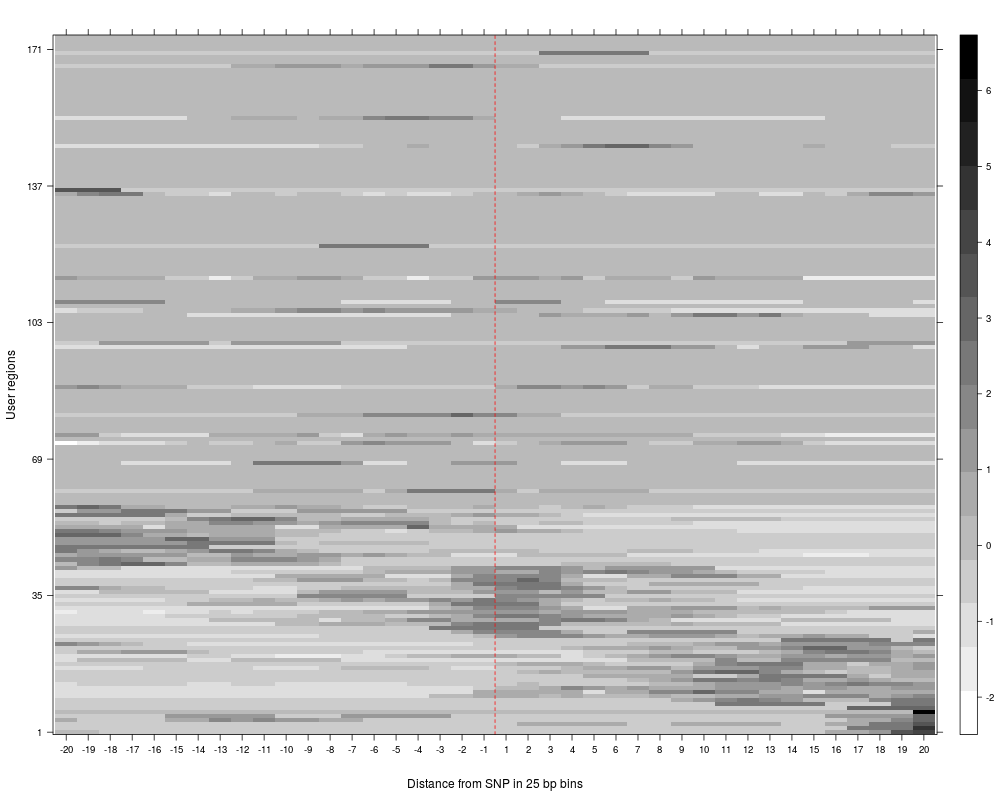
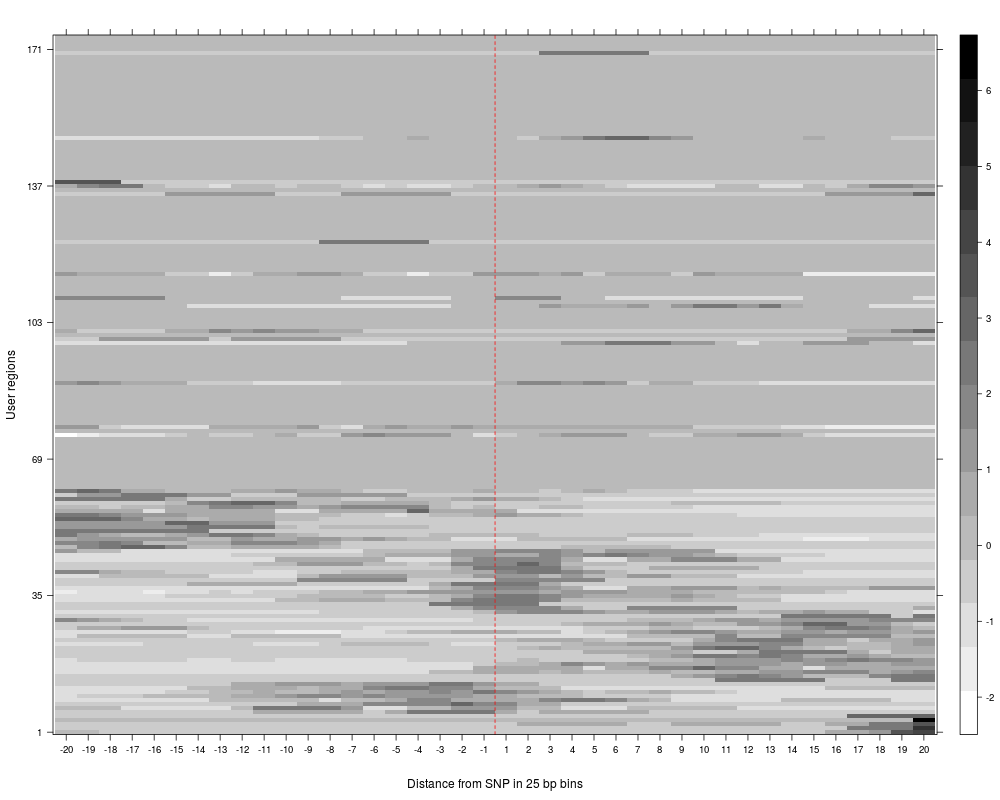
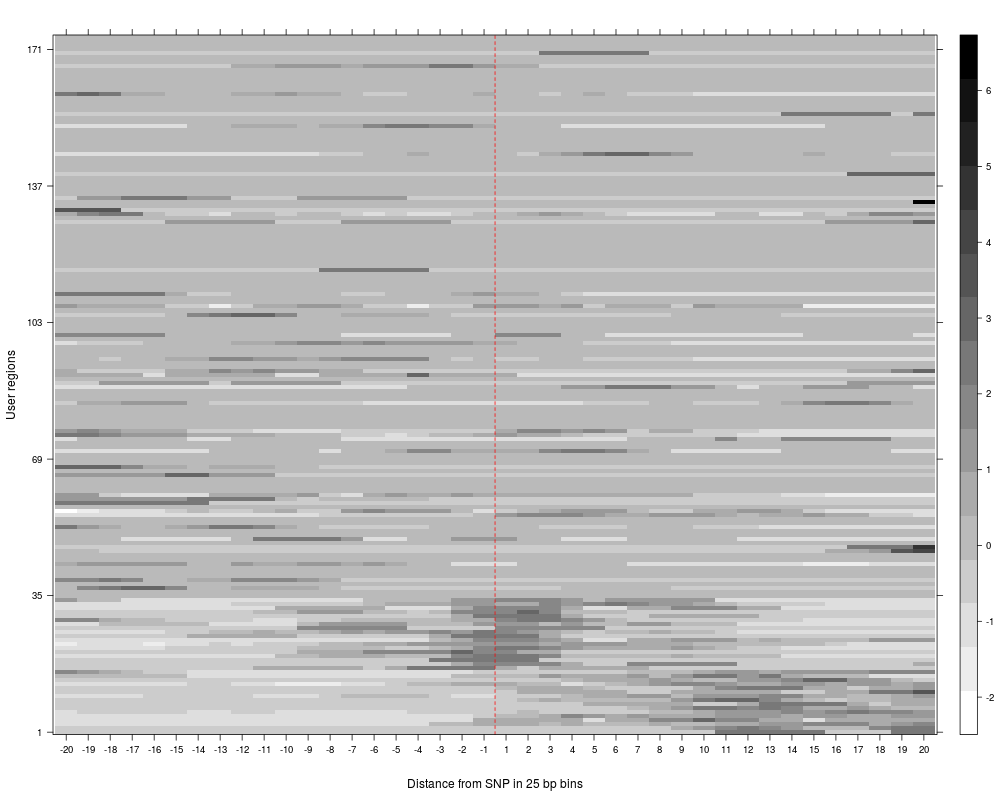
plotAndClusterMatrix can be used to cluster regions such as SNPs based on their local neighbourhood.
The underlying clustering is done using partitioning around medoids (PAM). For more details, see the vignette.
Character(1). Default NULL. Read group that should be plotted, specified by its name as obtained by the function annotationReadGroups). If only one read group is defined in the object, this may also be NULL for user conveniance.
dataset
Numeric(1) or Character(1). Single dataset that should be used for plotting, either specified as integer (such as 1, value must be
between 1 and the total number of datasets as defined in the object) or its annotation (name must appear in the dataset names as obtained via the function annotationDatasets).
nClustersVec
Numeric. Default 2. The number of clusters the data should be divided into. This can either be a vector or a single value. if multiple clusters are specified, multiple clustering analyses will be performed and for each of them, a plot is produced. make sure to specify the parameter fileToPlot in that case; otherwise, only the last plot may be visible.
normalize
Logical(1). Default TRUE. Should a normalization be done on the counts/enrichments values before clustering? If set to TRUE,
a normalization procedure based on subtracting the mean dividing by standard deviation for each region is performed. For more details, see the
vignette.
clustersToPlot
Integer. Default NULL. Vector of clusters that should be plotted. If set to NULL, all clusters from the clustering result
will be plotted. Otherwise, only the clusters as specified by the user are plotted, omitting regions belonging to other clusters. This
is useful to, for example, only display regions that show a bin-dependent pattern and are not invariant across the whole user region.
fileToPlot
Character(1) or NULL. Default NULL.
Filename of the PDF file for the output plots.
If set to NULL, plots will be plotted to the currently active device.
verbose
Logical(1). Default FALSE. Should the verbose mode (i.e., diagnostic messages during execution of the script) be enabled?
...
Additional graphical parameters that can be used to modify the output of the function levelplot (panel.levelplot).
See ?levelplot for details.
Value
The clustering reports the cluster in which each SNP falls, the average silhouette for pam clustering, plots for the clustered reads and a summary plot of average reads per cluster across the region being analyzed.
R version 3.3.1 (2016-06-21) -- "Bug in Your Hair"
Copyright (C) 2016 The R Foundation for Statistical Computing
Platform: x86_64-pc-linux-gnu (64-bit)

R is free software and comes with ABSOLUTELY NO WARRANTY.
You are welcome to redistribute it under certain conditions.
Type 'license()' or 'licence()' for distribution details.

R is a collaborative project with many contributors.
Type 'contributors()' for more information and
'citation()' on how to cite R or R packages in publications.

Type 'demo()' for some demos, 'help()' for on-line help, or
'help.start()' for an HTML browser interface to help.
Type 'q()' to quit R.

> library(SNPhood)
Loading required package: GenomicRanges
Loading required package: BiocGenerics
Loading required package: parallel

Attaching package: 'BiocGenerics'

The following objects are masked from 'package:parallel':

    clusterApply, clusterApplyLB, clusterCall, clusterEvalQ,
    clusterExport, clusterMap, parApply, parCapply, parLapply,
    parLapplyLB, parRapply, parSapply, parSapplyLB

The following objects are masked from 'package:stats':

    IQR, mad, xtabs

The following objects are masked from 'package:base':

    Filter, Find, Map, Position, Reduce, anyDuplicated, append,
    as.data.frame, cbind, colnames, do.call, duplicated, eval, evalq,
    get, grep, grepl, intersect, is.unsorted, lapply, lengths, mapply,
    match, mget, order, paste, pmax, pmax.int, pmin, pmin.int, rank,
    rbind, rownames, sapply, setdiff, sort, table, tapply, union,
    unique, unsplit

Loading required package: S4Vectors
Loading required package: stats4

Attaching package: 'S4Vectors'

The following objects are masked from 'package:base':

    colMeans, colSums, expand.grid, rowMeans, rowSums

Loading required package: IRanges
Loading required package: GenomeInfoDb
Loading required package: Rsamtools
Loading required package: Biostrings
Loading required package: XVector
Loading required package: data.table

Attaching package: 'data.table'

The following object is masked from 'package:GenomicRanges':

    shift

The following object is masked from 'package:IRanges':

    shift

Loading required package: checkmate

------------------------------------------------------------------------------------------------------------------
|       Welcome to the SNPhood package and thank you for using our software. This is SNPhood version 1.2.2.      |
| See the vignettes (type browseVignettes("SNPhood") or the help pages for how to use SNPhood for your analyses. |
|       Thank you for using our software. Please do not hesitate to contact us if there are any questions.       |
------------------------------------------------------------------------------------------------------------------

> png(filename="/home/ddbj/snapshot/RGM3/R_BC/result/SNPhood/plotAndClusterMatrix.Rd_%03d_medium.png", width=480, height=480)
> ### Name: plotAndClusterMatrix
> ### Title: Clustering of read counts or enrichmens across bins for a
> ###   specific dataset and read group
> ### Aliases: plotAndClusterMatrix
>
> ### ** Examples
>
> data(SNPhood.o, package="SNPhood")
> SNPhood.o = plotAndClusterMatrix(SNPhood.o, readGroup = "paternal", dataset = 1, nClustersVec = c(3:6))
> SNPhood.o = plotAndClusterMatrix(SNPhood.o, readGroup = "paternal", dataset = 1, normalize = FALSE)
>
>
>
>
>
> dev.off()
null device
          1
>
 .
.