R: Visualize counts or enrichment for a particular region across...
plotBinCounts
R Documentation
Visualize counts or enrichment for a particular region across bins, datasets, and read groups.
Description
plotBinCounts visualizes counts or enrichment for a particular region across bins, datasets, and read groups.
Many graphical parameters can be adjusted to suit the needs of the user, see below.
Numeric or Character or NULL. Default NULL. Regions that should be plotted, either specified as integer (such as 1, value must be
between 1 and the total number of regions as defined in the object) or their annotation (name must appear in the region names as obtained via the function annotationRegions). If set to NULL, all regions will be considered.
readGroups
Character or NULL. Default NULL. Read groups that should be plotted, specified by their name as obtained by the function annotationReadGroups). If set to NULL, all read groups will be considered.
datasets
Numeric or Character or NULL. Default NULL. Datasets that should be used for plotting, either specified as integer (such as 1, value must be
between 1 and the total number of datasets as defined in the object) or their annotation (name must appear in the dataset names as obtained via the function annotationDatasets). If set to NULL, all datasets will be considered.
readGroupColors
Character or NULL. Default NULL. Colors of the read groups that appear in the plot.
If set to NULL, colors will be set automatically. The length of the vector must equal the total number of read groups
that are defined in the SNPhood object.
ylim
Numeric(2). Default NULL. Range of the y-axis, as specified by a minimum and a maximum value. See ?ylim for details.
addGenotype
Logical(1). Default TRUE. Should the genotype distribution for each read group at the original user position be displayed in the legend in addition?
See the Vignette for more details how this distribution is determined.
plotGenotypeRatio
Logical(1). Default FALSE. Should the ratio of the genotypes be plotted instead of the count or enrichment values?
Only applicable if the number of read groups to be plotted is 2 and if one region is plotted. Setting this parameter to TRUE may result in ratios across bins that are interrupted due to
zero counts (and a resulting division by zero, which can therefore not be displayed). Also, ratios cannot be plotted if the genotype for the selected
regions could not be determined due to the lack of reads overlapping with the particular region (see the Vignette for details).
addTitle
Logical(1). Default TRUE. Should the plot contain a title that summarizes the genomic region that is visualized?
colorPalette
Character(1). Default "Set1". Name of the palette from the RColorBrewer package from the qualitative palettes
for the colors of the datasets that are plotted.
Allowed palette names are "Accent", "Dark2", "Paired", "Pastel1", "Pastel2", "Set1", "Set2", and "Set3". Colors for the datasets are
then determined automatically from the given palette name (from left to right, depending on the number of datasets to be plotted).
The colors for the read groups within each datasets are based on the colors for the dataset, but with different saturation values.
plotGraph
Logical(1). Default TRUE. Should the graphs be plotted to the current graphics device?
fileToPlot
Character(1) or NULL. Default NULL.
Filename of the PDF file for the output plots.
If set to NULL, plots will be plotted to the currently active device.
maxWidthLabels
Numeric(1). Default NULL. Maximum width of the legend labels in number of characters.
If the width of the legend labels are longer, they are shortened. Set to NULL to not shorten labels.
verbose
Logical(1). Default FALSE. Should the verbose mode (i.e., diagnostic messages during execution of the script) be enabled?
Value
the generated ggplot2 plot(s) as list for further processing. May contain multiple plots, depending on the function. The plot(s) can then be plotted individually or modified arbitrarily as the user wants. For example, if multiple plots are returned and the plots have been saved in a variable called plots.l, simply type plots.l[[1]] to view the first plot.
Examples
data(SNPhood.o, package="SNPhood")
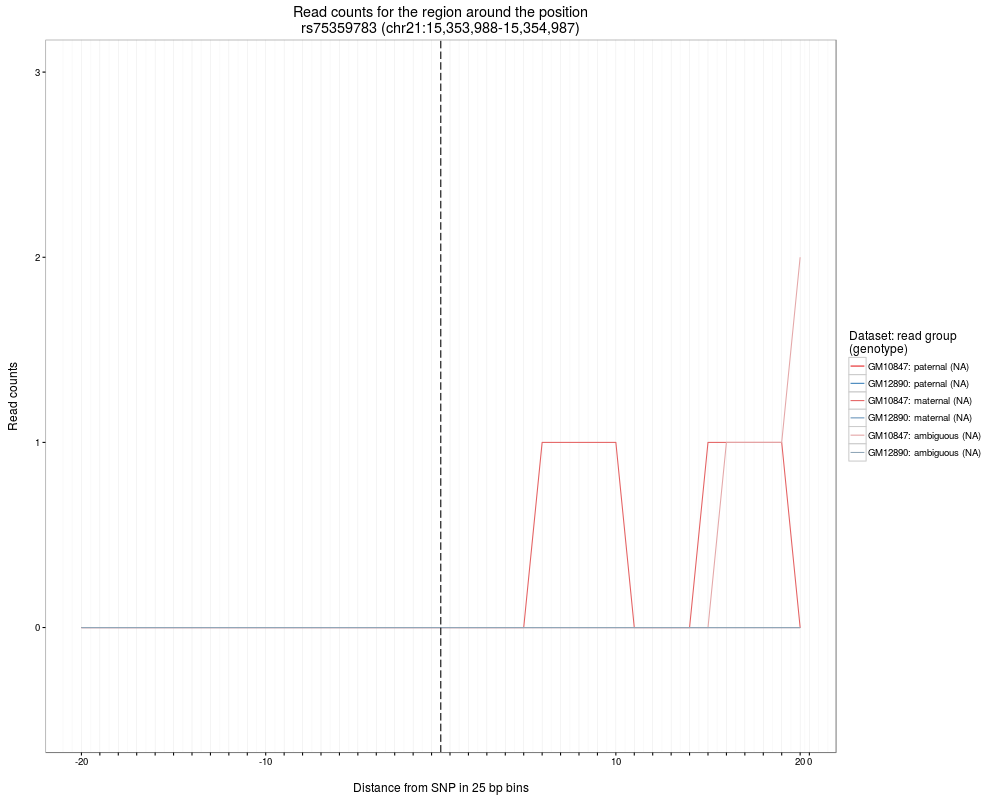
# Plot the first region, all parameters with their default values
plot = plotBinCounts(SNPhood.o)
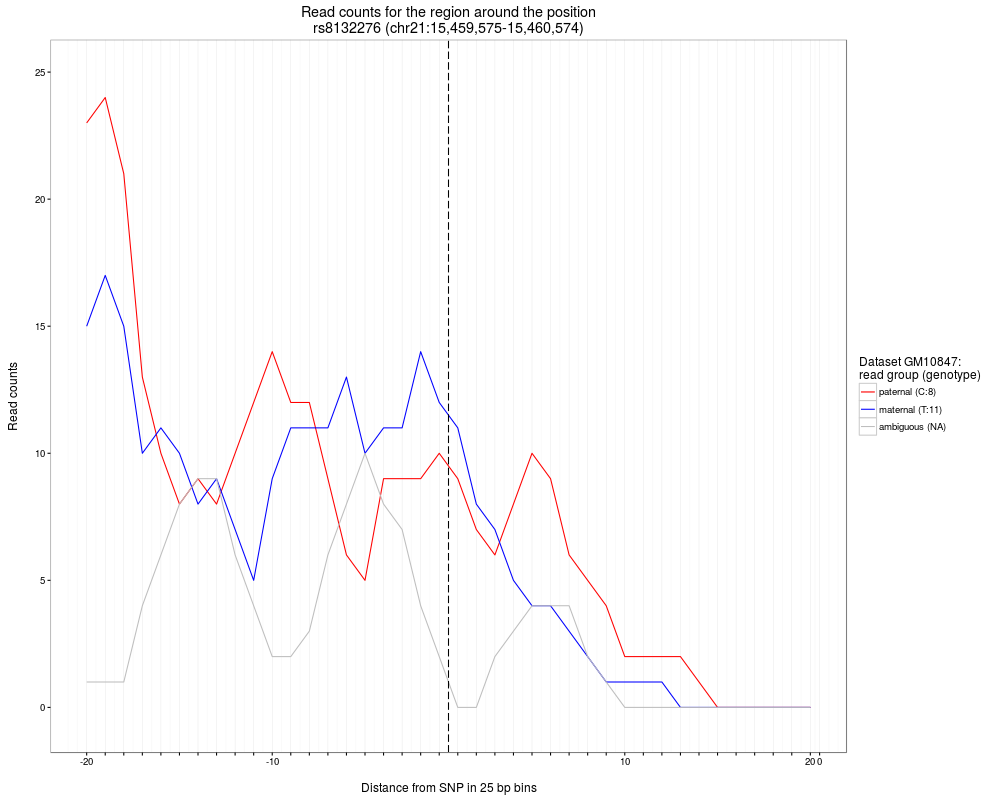
# Plot the second region for the first dataset, using specific colors for the read groups.
plot = plotBinCounts(SNPhood.o, regions = 2, dataset = 1, readGroupColors = c("red","blue","gray"))
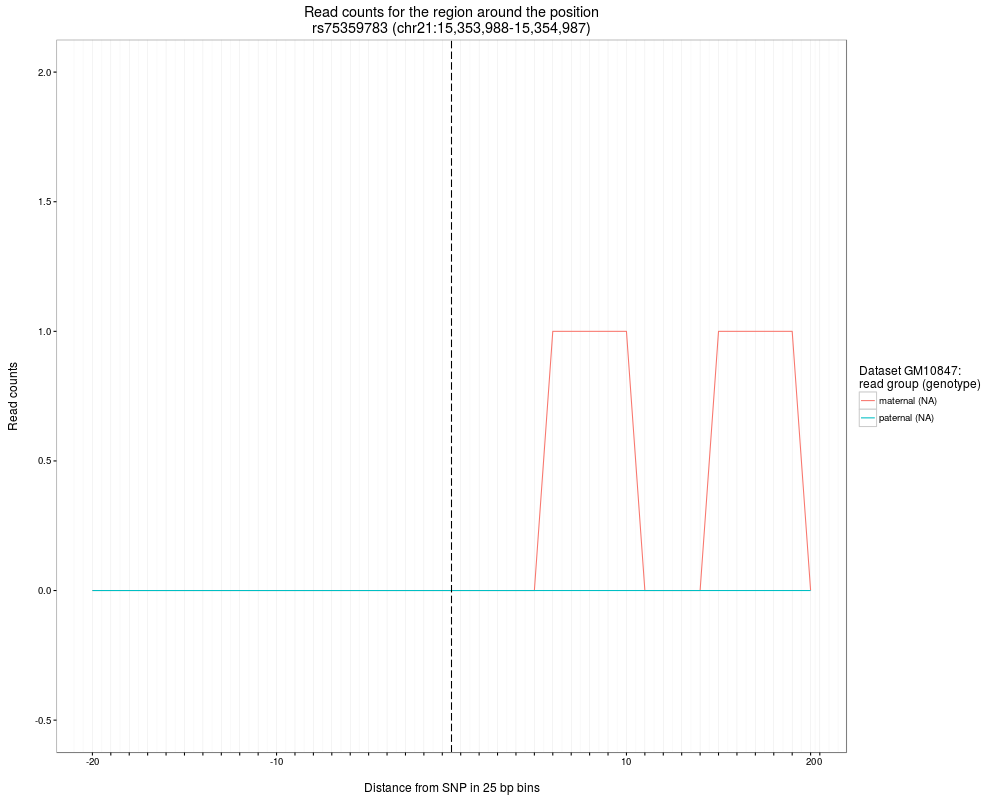
# Plot the first region for the first dataset and the genotype ratio. Save the plot in a variable
plot = plotBinCounts(SNPhood.o, regions = 1, readGroups = c("maternal", "paternal"), dataset = 1, plotGenotypeRatio = TRUE)
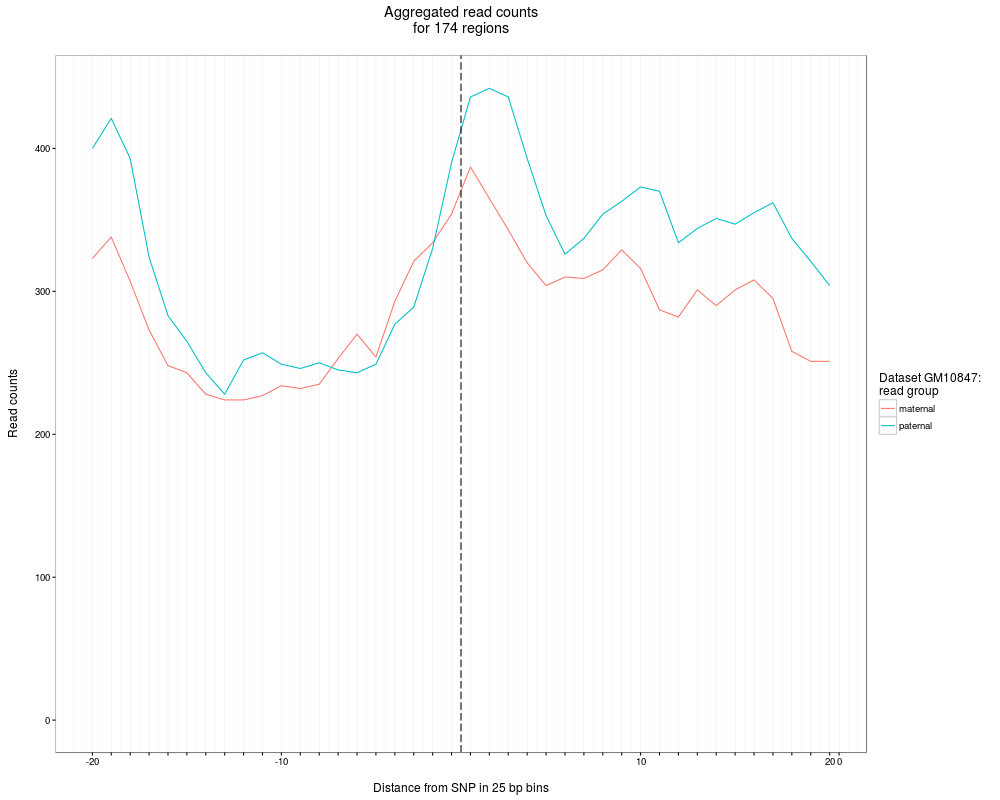
#' # Plot all regions for the first dataset and aggregate. Save the plot in a variable
plot = plotBinCounts(SNPhood.o, regions = NULL, readGroups = c("maternal", "paternal"), dataset = 1)
Results
R version 3.3.1 (2016-06-21) -- "Bug in Your Hair"
Copyright (C) 2016 The R Foundation for Statistical Computing
Platform: x86_64-pc-linux-gnu (64-bit)

R is free software and comes with ABSOLUTELY NO WARRANTY.
You are welcome to redistribute it under certain conditions.
Type 'license()' or 'licence()' for distribution details.

R is a collaborative project with many contributors.
Type 'contributors()' for more information and
'citation()' on how to cite R or R packages in publications.

Type 'demo()' for some demos, 'help()' for on-line help, or
'help.start()' for an HTML browser interface to help.
Type 'q()' to quit R.

> library(SNPhood)
Loading required package: GenomicRanges
Loading required package: BiocGenerics
Loading required package: parallel

Attaching package: 'BiocGenerics'

The following objects are masked from 'package:parallel':

    clusterApply, clusterApplyLB, clusterCall, clusterEvalQ,
    clusterExport, clusterMap, parApply, parCapply, parLapply,
    parLapplyLB, parRapply, parSapply, parSapplyLB

The following objects are masked from 'package:stats':

    IQR, mad, xtabs

The following objects are masked from 'package:base':

    Filter, Find, Map, Position, Reduce, anyDuplicated, append,
    as.data.frame, cbind, colnames, do.call, duplicated, eval, evalq,
    get, grep, grepl, intersect, is.unsorted, lapply, lengths, mapply,
    match, mget, order, paste, pmax, pmax.int, pmin, pmin.int, rank,
    rbind, rownames, sapply, setdiff, sort, table, tapply, union,
    unique, unsplit

Loading required package: S4Vectors
Loading required package: stats4

Attaching package: 'S4Vectors'

The following objects are masked from 'package:base':

    colMeans, colSums, expand.grid, rowMeans, rowSums

Loading required package: IRanges
Loading required package: GenomeInfoDb
Loading required package: Rsamtools
Loading required package: Biostrings
Loading required package: XVector
Loading required package: data.table

Attaching package: 'data.table'

The following object is masked from 'package:GenomicRanges':

    shift

The following object is masked from 'package:IRanges':

    shift

Loading required package: checkmate

------------------------------------------------------------------------------------------------------------------
|       Welcome to the SNPhood package and thank you for using our software. This is SNPhood version 1.2.2.      |
| See the vignettes (type browseVignettes("SNPhood") or the help pages for how to use SNPhood for your analyses. |
|       Thank you for using our software. Please do not hesitate to contact us if there are any questions.       |
------------------------------------------------------------------------------------------------------------------

> png(filename="/home/ddbj/snapshot/RGM3/R_BC/result/SNPhood/plotBinCounts.Rd_%03d_medium.png", width=480, height=480)
> ### Name: plotBinCounts
> ### Title: Visualize counts or enrichment for a particular region across
> ###   bins, datasets, and read groups.
> ### Aliases: plotBinCounts
>
> ### ** Examples
>
> data(SNPhood.o, package="SNPhood")
>
> # Plot the first region, all parameters with their default values
> plot = plotBinCounts(SNPhood.o)
>
> # Plot the second region for the first dataset, using specific colors for the read groups.
> plot = plotBinCounts(SNPhood.o, regions = 2, dataset = 1, readGroupColors = c("red","blue","gray"))
>
> # Plot the first region for the first dataset and the genotype ratio. Save the plot in a variable
> plot = plotBinCounts(SNPhood.o, regions = 1, readGroups = c("maternal", "paternal"), dataset = 1, plotGenotypeRatio = TRUE)
Warning messages:
1: In plotBinCounts(SNPhood.o, regions = 1, readGroups = c("maternal",  :
  Excluding dataset NA from plot because the SNP is homozygous.
2: In plotBinCounts(SNPhood.o, regions = 1, readGroups = c("maternal",  :
  No datasets left to plot the genotype ratio. Plotting normal read counts instead.
>
> #' # Plot all regions for the first dataset and aggregate. Save the plot in a variable
> plot = plotBinCounts(SNPhood.o, regions = NULL, readGroups = c("maternal", "paternal"), dataset = 1)
Warning message:
In plotBinCounts(SNPhood.o, regions = NULL, readGroups = c("maternal",  :
  Cannot add genotype as the number of regions to plot is 174 and not 1.
>
>
>
>
>
>
> dev.off()
null device
          1
>
 .
.