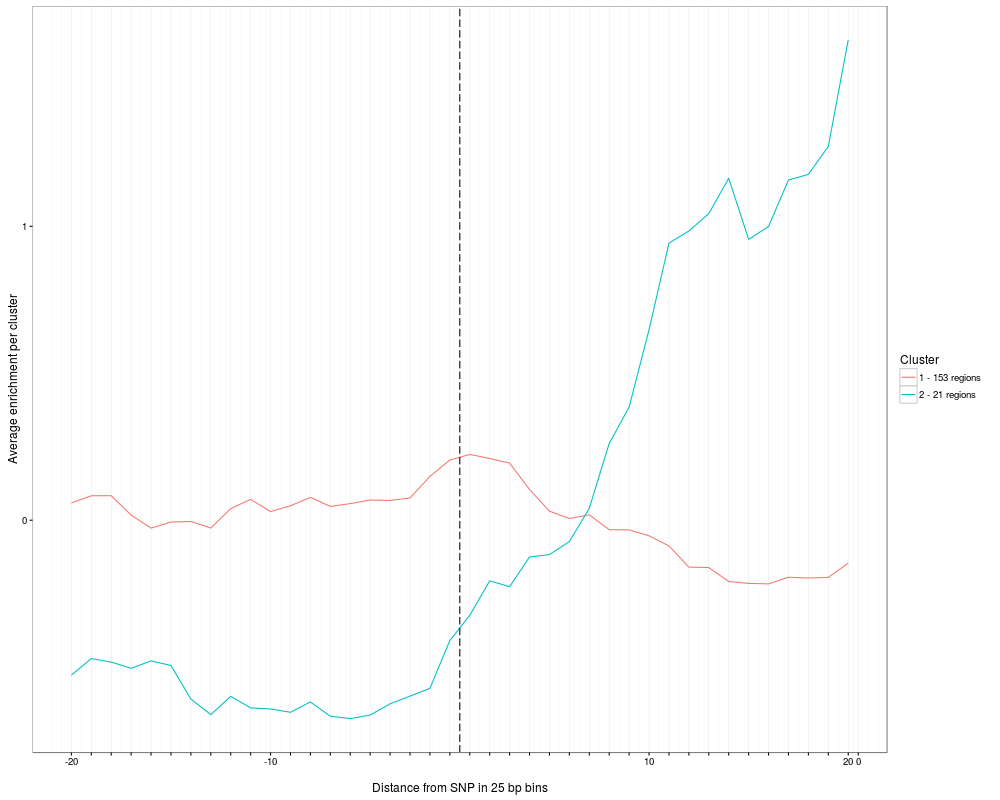
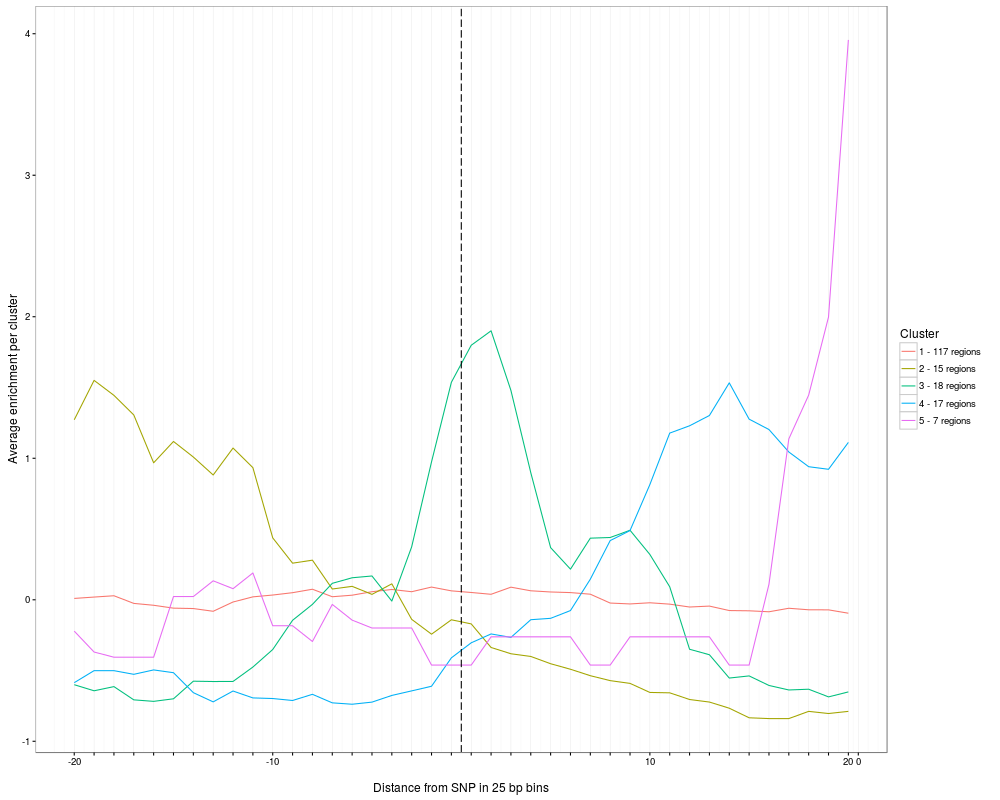
plotClusterAverage visualizes the average reads per cluster. Note that the function plotAndClusterMatrix has to be executed
before plotClusterAverage is called for the same read group and dataset
Character(1). Default NULL. Read group that should be plotted, specified by its name as obtained by the function annotationReadGroups). If only one read group is defined in the object, this may also be NULL for user conveniance.
dataset
Numeric(1) or Character(1). Single dataset that should be used for plotting, either specified as integer (such as 1, value must be
between 1 and the total number of datasets as defined in the object) or its annotation (name must appear in the dataset names as obtained via the function annotationDatasets).
fileToPlot
Character(1) or NULL. Default NULL.
Filename of the PDF file for the output plots.
If set to NULL, plots will be plotted to the currently active device.
verbose
Logical(1). Default FALSE. Should the verbose mode (i.e., diagnostic messages during execution of the script) be enabled?
Value
the generated ggplot2 plot(s) as list for further processing. May contain multiple plots, depending on the function. The plot(s) can then be plotted individually or modified arbitrarily as the user wants. For example, if multiple plots are returned and the plots have been saved in a variable called plots.l, simply type plots.l[[1]] to view the first plot.
R version 3.3.1 (2016-06-21) -- "Bug in Your Hair"
Copyright (C) 2016 The R Foundation for Statistical Computing
Platform: x86_64-pc-linux-gnu (64-bit)

R is free software and comes with ABSOLUTELY NO WARRANTY.
You are welcome to redistribute it under certain conditions.
Type 'license()' or 'licence()' for distribution details.

R is a collaborative project with many contributors.
Type 'contributors()' for more information and
'citation()' on how to cite R or R packages in publications.

Type 'demo()' for some demos, 'help()' for on-line help, or
'help.start()' for an HTML browser interface to help.
Type 'q()' to quit R.

> library(SNPhood)
Loading required package: GenomicRanges
Loading required package: BiocGenerics
Loading required package: parallel

Attaching package: 'BiocGenerics'

The following objects are masked from 'package:parallel':

    clusterApply, clusterApplyLB, clusterCall, clusterEvalQ,
    clusterExport, clusterMap, parApply, parCapply, parLapply,
    parLapplyLB, parRapply, parSapply, parSapplyLB

The following objects are masked from 'package:stats':

    IQR, mad, xtabs

The following objects are masked from 'package:base':

    Filter, Find, Map, Position, Reduce, anyDuplicated, append,
    as.data.frame, cbind, colnames, do.call, duplicated, eval, evalq,
    get, grep, grepl, intersect, is.unsorted, lapply, lengths, mapply,
    match, mget, order, paste, pmax, pmax.int, pmin, pmin.int, rank,
    rbind, rownames, sapply, setdiff, sort, table, tapply, union,
    unique, unsplit

Loading required package: S4Vectors
Loading required package: stats4

Attaching package: 'S4Vectors'

The following objects are masked from 'package:base':

    colMeans, colSums, expand.grid, rowMeans, rowSums

Loading required package: IRanges
Loading required package: GenomeInfoDb
Loading required package: Rsamtools
Loading required package: Biostrings
Loading required package: XVector
Loading required package: data.table

Attaching package: 'data.table'

The following object is masked from 'package:GenomicRanges':

    shift

The following object is masked from 'package:IRanges':

    shift

Loading required package: checkmate

------------------------------------------------------------------------------------------------------------------
|       Welcome to the SNPhood package and thank you for using our software. This is SNPhood version 1.2.2.      |
| See the vignettes (type browseVignettes("SNPhood") or the help pages for how to use SNPhood for your analyses. |
|       Thank you for using our software. Please do not hesitate to contact us if there are any questions.       |
------------------------------------------------------------------------------------------------------------------

> png(filename="/home/ddbj/snapshot/RGM3/R_BC/result/SNPhood/plotClusterAverage.Rd_%03d_medium.png", width=480, height=480)
> ### Name: plotClusterAverage
> ### Title: Visualize average enrichment per cluster
> ### Aliases: plotClusterAverage
>
> ### ** Examples
>
> data(SNPhood.o, package="SNPhood")
> plot = plotClusterAverage(SNPhood.o, readGroup = "paternal", dataset = 1)
Warning message:
In plotClusterAverage(SNPhood.o, readGroup = "paternal", dataset = 1) :
  Multiple clustering results found, summarizing all of them. Multiple plots will be produced. Specify a filename for the parameter fileToPlot to see them all.
>
>
>
>
>
> dev.off()
null device
          1
>
 .
.