R: Visualize average counts/enrichment based on strong and weak...
plotGenotypesPerCluster
R Documentation
Visualize average counts/enrichment based on strong and weak genotypes.
Description
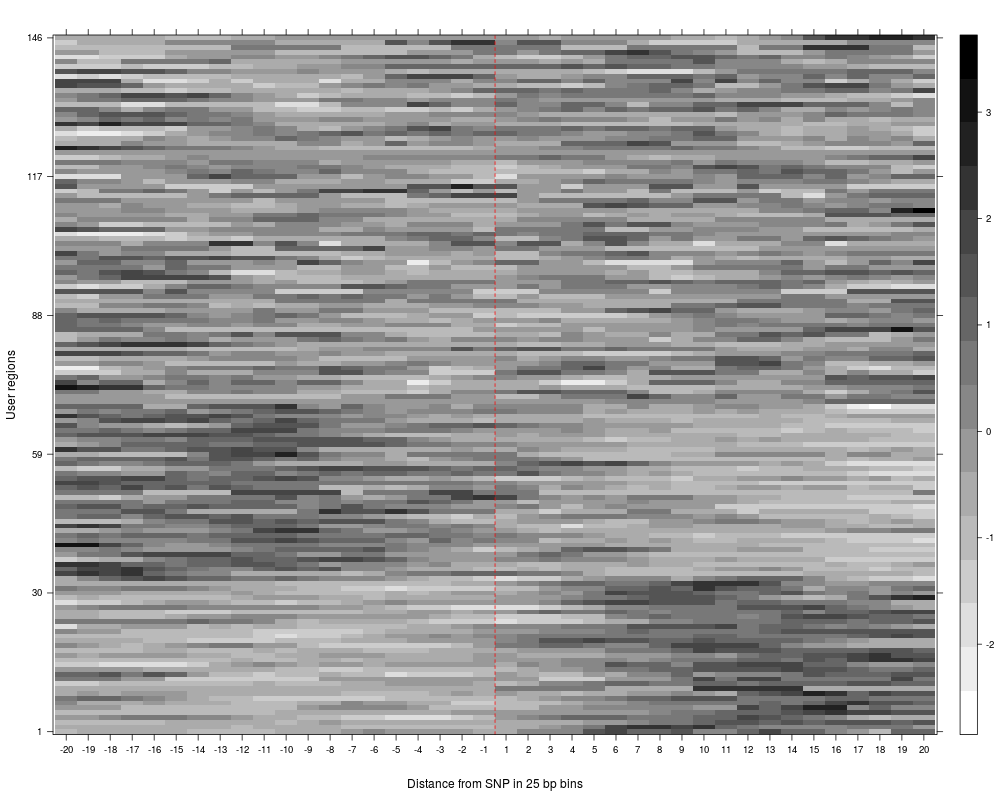
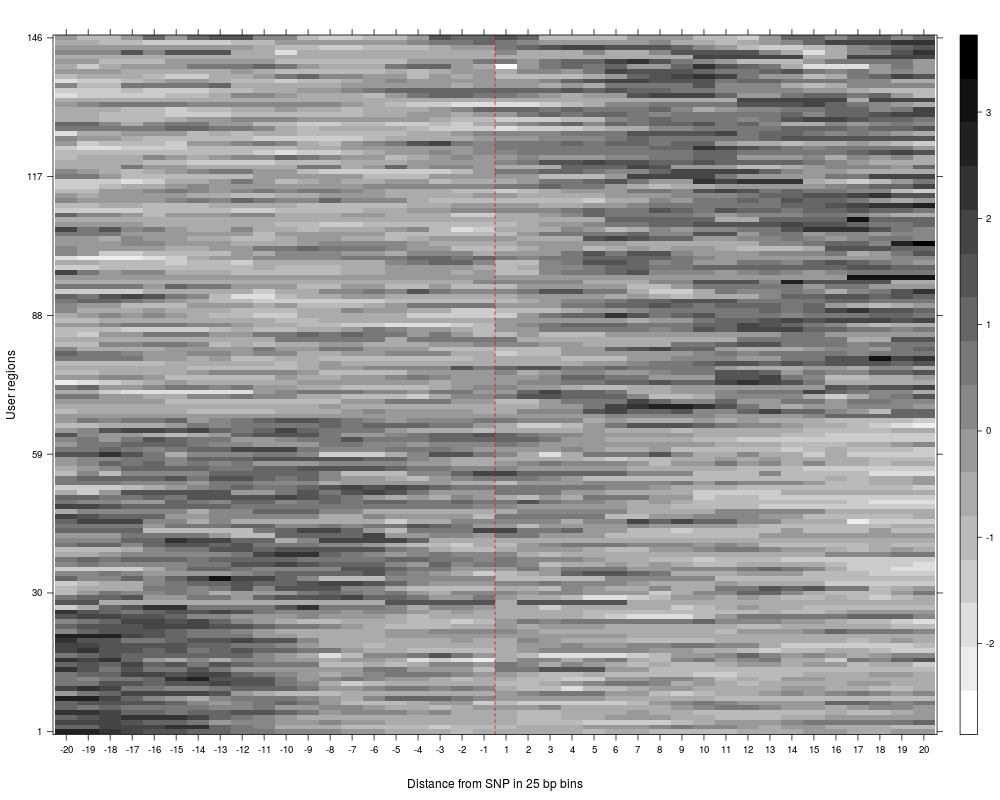
The function plotGenotypesPerCluster plots average clusters per genotype based on the clustering results of
the strong an weak genotype analysis (see plotAndCalculateWeakAndStrongGenotype), which has to be executed before.
Logical(1). Default TRUE. Should the bin labels be printed?
If multiple clusters are plotted simultaenously, bin labels might overlap, in which case printBinLabels can be set to FALSE.
fileToPlot
Character(1) or NULL. Default NULL.
Filename of the PDF file for the output plots.
If set to NULL, plots will be plotted to the currently active device.
printPlot
Logical(1). Default TRUE. Should the plots be printed? Only relevant if fileToPlot is set to NULL; otherwise, the plots
are always printed to the output file.
verbose
Logical(1). Default FALSE. Should the verbose mode (i.e., diagnostic messages during execution of the script) be enabled?
Value
the generated ggplot2 plot(s) as list for further processing. May contain multiple plots, depending on the function. The plot(s) can then be plotted individually or modified arbitrarily as the user wants. For example, if multiple plots are returned and the plots have been saved in a variable called plots.l, simply type plots.l[[1]] to view the first plot.
R version 3.3.1 (2016-06-21) -- "Bug in Your Hair"
Copyright (C) 2016 The R Foundation for Statistical Computing
Platform: x86_64-pc-linux-gnu (64-bit)

R is free software and comes with ABSOLUTELY NO WARRANTY.
You are welcome to redistribute it under certain conditions.
Type 'license()' or 'licence()' for distribution details.

R is a collaborative project with many contributors.
Type 'contributors()' for more information and
'citation()' on how to cite R or R packages in publications.

Type 'demo()' for some demos, 'help()' for on-line help, or
'help.start()' for an HTML browser interface to help.
Type 'q()' to quit R.

> library(SNPhood)
Loading required package: GenomicRanges
Loading required package: BiocGenerics
Loading required package: parallel

Attaching package: 'BiocGenerics'

The following objects are masked from 'package:parallel':

    clusterApply, clusterApplyLB, clusterCall, clusterEvalQ,
    clusterExport, clusterMap, parApply, parCapply, parLapply,
    parLapplyLB, parRapply, parSapply, parSapplyLB

The following objects are masked from 'package:stats':

    IQR, mad, xtabs

The following objects are masked from 'package:base':

    Filter, Find, Map, Position, Reduce, anyDuplicated, append,
    as.data.frame, cbind, colnames, do.call, duplicated, eval, evalq,
    get, grep, grepl, intersect, is.unsorted, lapply, lengths, mapply,
    match, mget, order, paste, pmax, pmax.int, pmin, pmin.int, rank,
    rbind, rownames, sapply, setdiff, sort, table, tapply, union,
    unique, unsplit

Loading required package: S4Vectors
Loading required package: stats4

Attaching package: 'S4Vectors'

The following objects are masked from 'package:base':

    colMeans, colSums, expand.grid, rowMeans, rowSums

Loading required package: IRanges
Loading required package: GenomeInfoDb
Loading required package: Rsamtools
Loading required package: Biostrings
Loading required package: XVector
Loading required package: data.table

Attaching package: 'data.table'

The following object is masked from 'package:GenomicRanges':

    shift

The following object is masked from 'package:IRanges':

    shift

Loading required package: checkmate

------------------------------------------------------------------------------------------------------------------
|       Welcome to the SNPhood package and thank you for using our software. This is SNPhood version 1.2.2.      |
| See the vignettes (type browseVignettes("SNPhood") or the help pages for how to use SNPhood for your analyses. |
|       Thank you for using our software. Please do not hesitate to contact us if there are any questions.       |
------------------------------------------------------------------------------------------------------------------

> png(filename="/home/ddbj/snapshot/RGM3/R_BC/result/SNPhood/plotGenotypesPerCluster.Rd_%03d_medium.png", width=480, height=480)
> ### Name: plotGenotypesPerCluster
> ### Title: Visualize average counts/enrichment based on strong and weak
> ###   genotypes.
> ### Aliases: plotGenotypesPerCluster
>
> ### ** Examples
>
> data(SNPhood.o, package="SNPhood")
> SNPhood_merged.o = mergeReadGroups(SNPhood.o)
Check object integrity and validity. For large objects, this may take some time. Use the function changeObjectIntegrityChecking to disable this check for the object.
> SNPhood_merged.o = plotAndCalculateWeakAndStrongGenotype(SNPhood_merged.o)
[[1]]

[[1]]

> plot = plotGenotypesPerCluster(SNPhood_merged.o, printPlot = FALSE)
>
>
>
>
>
> dev.off()
null device
          1
>
 .
.