Supported by Dr. Osamu Ogasawara and  . . |
|
Last data update: 2014.03.03 |
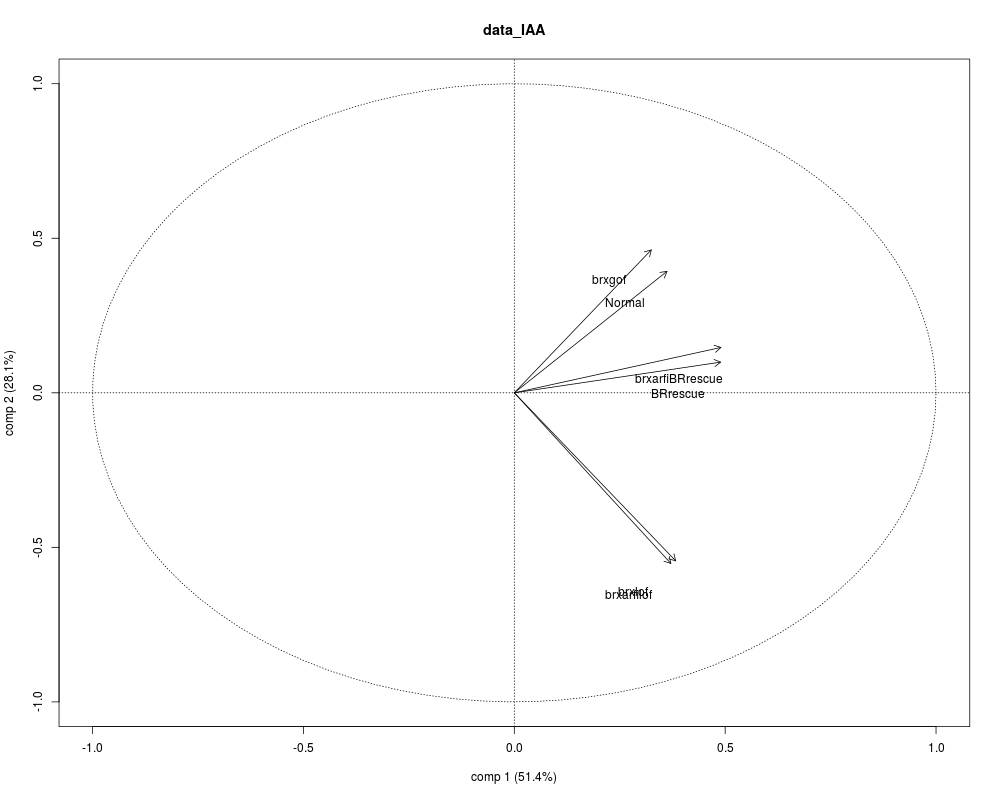
Generate the Correlation Circle.DescriptionThis method generates the correlation circle. Correlation circle is used to assess the coherence of a model. Indeed, Each vector represents our conditions and the angle between each vector give the correlation between the variables. if the angle is higher than 90 degrees there is no correlation. UsageplotCC(object) Arguments
DetailsThe percentage of variability explained by the two first principal components are displayed in parenthesis in the axis label. Author(s)Martial Sankar See AlsoMore specific information in Examples
fpath <- system.file("extdata", package="SQUADD")
fileModel <- file.path(fpath,"data_IAA")
nm <- c("ARF(a)", "ARF(i)", "AR_Genes", "Aux/IAA", "BES1/BZR1",
 "BIN2", "BR", "BRI1-BAK1","BRR_Genes","BRX","BR_Biosynthesis","BZR1",
  "DO", "IAA", "IAA_Biosynthesis", "NGA1", "PIN", "SCFTir1",
  "StimAux", "StimBR")
t <- 50

## call constructor
obj <- simResService(
		folder=fileModel,
		time=t,
		ncolor=5,
		legend=nm,
		indexDeno=1,
		method="lowess",
		conditionList=c("Normal", "brxlof", "BRrescue","brxarfilof",
		             "brxarfiBRrescue", "brxgof")
)
## call method
plotCC(obj)
Results
R version 3.3.1 (2016-06-21) -- "Bug in Your Hair"
Copyright (C) 2016 The R Foundation for Statistical Computing
Platform: x86_64-pc-linux-gnu (64-bit)

R is free software and comes with ABSOLUTELY NO WARRANTY.
You are welcome to redistribute it under certain conditions.
Type 'license()' or 'licence()' for distribution details.

R is a collaborative project with many contributors.
Type 'contributors()' for more information and
'citation()' on how to cite R or R packages in publications.

Type 'demo()' for some demos, 'help()' for on-line help, or
'help.start()' for an HTML browser interface to help.
Type 'q()' to quit R.

> library(SQUADD)
> png(filename="/home/ddbj/snapshot/RGM3/R_BC/result/SQUADD/plotCC.Rd_%03d_medium.png", width=480, height=480)
> ### Name: plotCC
> ### Title: Generate the Correlation Circle.
> ### Aliases: plotCC
> ### Keywords: correlation PCA circle
>
> ### ** Examples
>
> fpath <- system.file("extdata", package="SQUADD")
> fileModel <- file.path(fpath,"data_IAA")
> nm <- c("ARF(a)", "ARF(i)", "AR_Genes", "Aux/IAA", "BES1/BZR1",
+  "BIN2", "BR", "BRI1-BAK1","BRR_Genes","BRX","BR_Biosynthesis","BZR1",
+   "DO", "IAA", "IAA_Biosynthesis", "NGA1", "PIN", "SCFTir1",
+   "StimAux", "StimBR")
> t <- 50
>
> ## call constructor
> obj <- simResService(
+ 		folder=fileModel,
+ 		time=t,
+ 		ncolor=5,
+ 		legend=nm,
+ 		indexDeno=1,
+ 		method="lowess",
+ 		conditionList=c("Normal", "brxlof", "BRrescue","brxarfilof",
+ 		             "brxarfiBRrescue", "brxgof")
+ )
> ## call method
> plotCC(obj)
>
>
>
>
>
> dev.off()
null device
          1
>
|
Created & Maintained by Osamu Ogasawara (osamu.ogasawara@gmail.com) and 