Supported by Dr. Osamu Ogasawara and  . . |
|
Last data update: 2014.03.03 |
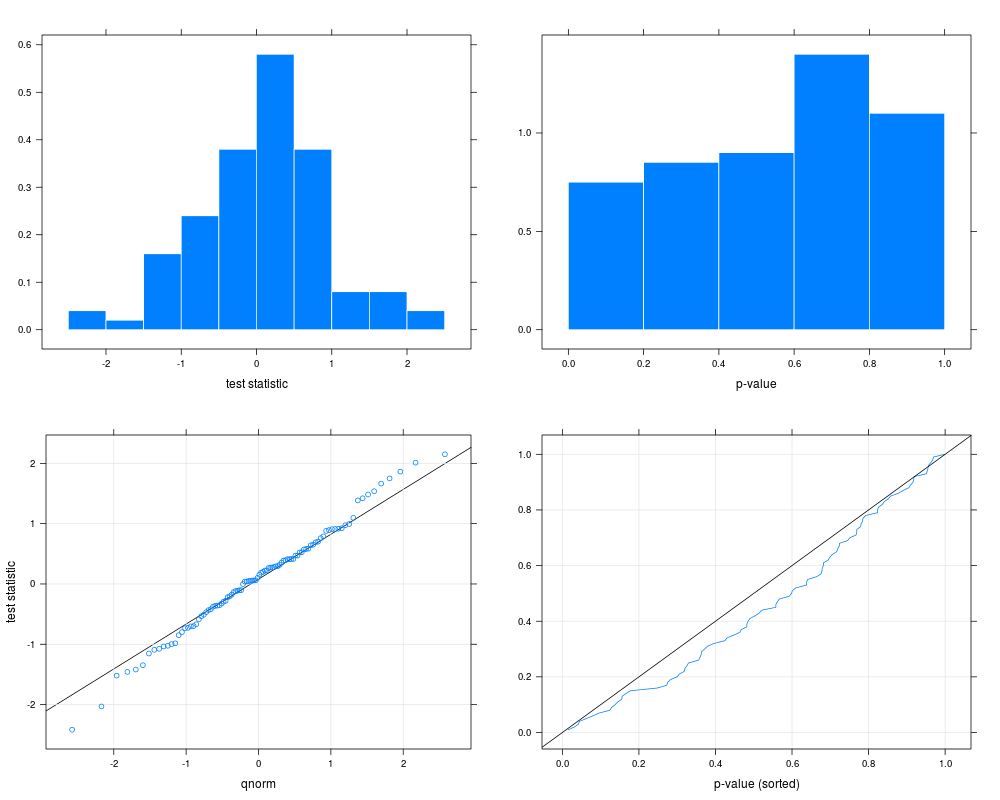
User friendly interface to class "PilotData"DescriptionUser friendly interface to class "PilotData" Usage
  pilotData(statistics = NULL, samplesize = NULL,
    distribution = c("norm", "t", "f", "chisq"), ...)
Arguments
DetailsIn the two-group case the effective sample size is defined as the square-root of the inverse of 1/n1 + 1/n2. Valueobject of class "PilotData" Author(s)Maarten van Iterson Examplespd <- pilotData(statistics=rnorm(100), samplesize=10, distribution="norm") pd plot(pd) Results
R version 3.3.1 (2016-06-21) -- "Bug in Your Hair"
Copyright (C) 2016 The R Foundation for Statistical Computing
Platform: x86_64-pc-linux-gnu (64-bit)

R is free software and comes with ABSOLUTELY NO WARRANTY.
You are welcome to redistribute it under certain conditions.
Type 'license()' or 'licence()' for distribution details.

R is a collaborative project with many contributors.
Type 'contributors()' for more information and
'citation()' on how to cite R or R packages in publications.

Type 'demo()' for some demos, 'help()' for on-line help, or
'help.start()' for an HTML browser interface to help.
Type 'q()' to quit R.

> library(SSPA)
Loading required package: qvalue
Loading required package: lattice
Loading required package: limma
> png(filename="/home/ddbj/snapshot/RGM3/R_BC/result/SSPA/pilotData.Rd_%03d_medium.png", width=480, height=480)
> ### Name: pilotData
> ### Title: User friendly interface to class "PilotData"
> ### Aliases: pilotData
>
> ### ** Examples
>
> pd <- pilotData(statistics=rnorm(100), samplesize=10, distribution="norm")
> pd
Formal class 'PilotData' [package "SSPA"] with 5 slots
  ..@ statistics  : num [1:100] 0.417 -0.223 1.407 -1.321 1.301 ...
  ..@ samplesize  : num 10
  ..@ pvalues     : num [1:100] 0.677 0.823 0.159 0.187 0.193 ...
  ..@ distribution: chr "norm"
  ..@ args        : list()
> plot(pd)
>
>
>
>
>
> dev.off()
null device
          1
>
|
Created & Maintained by Osamu Ogasawara (osamu.ogasawara@gmail.com) and 