Character specifying which components to plot; "common", "individual" or "both"
comps
Components to plot. If combined=FALSE, specifies the component indices to use as x and y for the plot. Otherwise, the component from the first block and the component from second block to plot together.
block
Which block to plot, either "1" or "2" or the name of the block.
title
Plot title
colorCol
Character specifying a pData column to use to colorise the plot points
sizeValues
Vector containing sizes for scores and loadings
shapeValues
Vector indicating the shapes for scores and loadings
R version 3.3.1 (2016-06-21) -- "Bug in Your Hair"
Copyright (C) 2016 The R Foundation for Statistical Computing
Platform: x86_64-pc-linux-gnu (64-bit)
R is free software and comes with ABSOLUTELY NO WARRANTY.
You are welcome to redistribute it under certain conditions.
Type 'license()' or 'licence()' for distribution details.
R is a collaborative project with many contributors.
Type 'contributors()' for more information and
'citation()' on how to cite R or R packages in publications.
Type 'demo()' for some demos, 'help()' for on-line help, or
'help.start()' for an HTML browser interface to help.
Type 'q()' to quit R.
> library(STATegRa)
Warning message:
replacing previous import 'Biobase::combine' by 'gridExtra::combine' when loading 'STATegRa'
> png(filename="/home/ddbj/snapshot/RGM3/R_BC/result/STATegRa/biplotRes.Rd_%03d_medium.png", width=480, height=480)
> ### Name: biplotRes
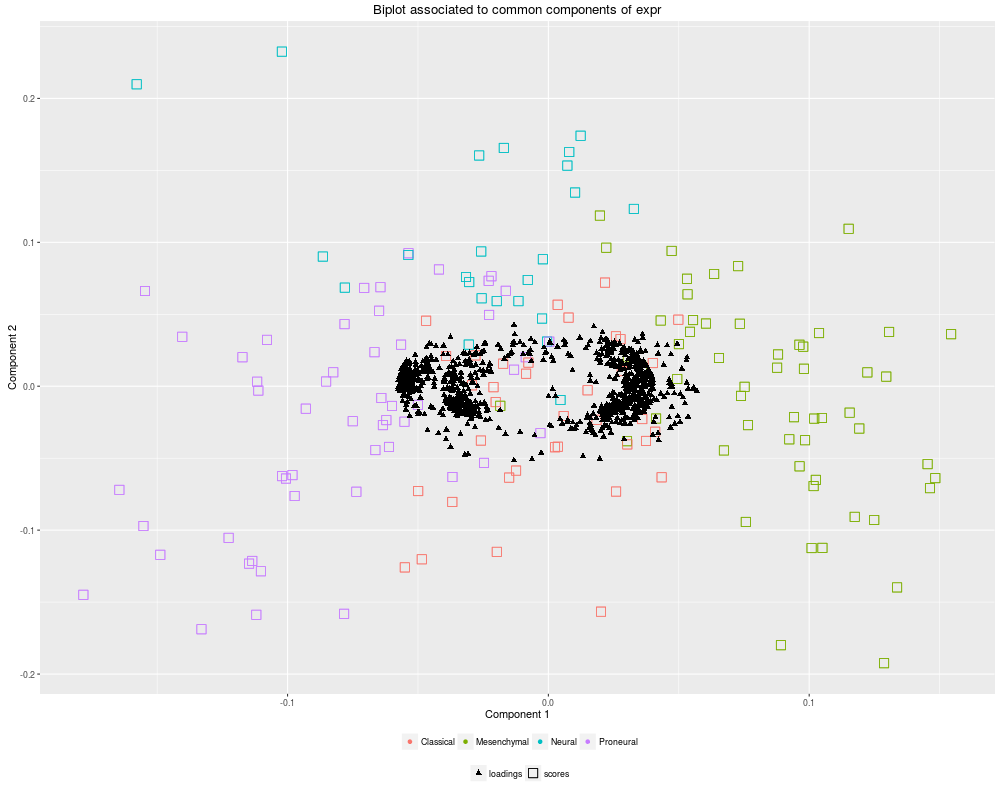
> ### Title: Biplot of component analysis
> ### Aliases: biplotRes biplotRes,caClass,character,numeric,character-method
>
> ### ** Examples
>
> data("STATegRa_S3")
> B1 <- createOmicsExpressionSet(Data=Block1.PCA,pData=ed.PCA,
+ pDataDescr=c("classname"))
> B2 <- createOmicsExpressionSet(Data=Block2.PCA,
+ pData=ed.PCA,pDataDescr=c("classname"))
> # Omics components analysis
> discoRes <- omicsCompAnalysis(Input=list(B1,B2),Names=c("expr","mirna"),
+ method="DISCOSCA",Rcommon=2,Rspecific=c(2,2),
+ center=TRUE,scale=TRUE,weight=TRUE)
> jiveRes <- omicsCompAnalysis(Input=list(B1,B2),Names=c("expr","mirna"),
+ method="JIVE",Rcommon=2,Rspecific=c(2,2),
+ center=TRUE,scale=TRUE,weight=TRUE)
>
> o2plsRes <- omicsCompAnalysis(Input=list(B1,B2),Names=c("expr","mirna"),
+ method="O2PLS",Rcommon=2,Rspecific=c(2,2),
+ center=TRUE,scale=TRUE,weight=TRUE)
>
> # Biplot common part. DISCO-SCA
>
> biplotRes(object=discoRes,type="common",comps=c(1,2),block="",
+ title=NULL,colorCol="classname",sizeValues=c(2,4),
+ shapeValues=c(17,0),background=TRUE,pointSize=4,
+ labelSize=NULL,axisSize=NULL,titleSize=NULL)
>
> # Biplot common part. O2PLS
>
> p1 <- biplotRes(object=o2plsRes,type="common",comps=c(1,2),
+ block="expr",title=NULL,colorCol="classname",
+ sizeValues=c(2,4),shapeValues=c(17,0),
+ background=TRUE,pointSize=4,labelSize=NULL,
+ axisSize=NULL,titleSize=NULL)
Warning message:
In data.row.names(row.names, rowsi, i) :
some row.names duplicated: 170,171,172,173,174,175,176,177,178,179,180,181,182,183,184,185,186,187,188,189,190,191,192,193,194,195,196,197,198,199,200,201,202,203,204,205,206,207,208,209,210,211,212,213,214,215,216,217,218,219,220,221,222,223,224,225,226,227,228,229,230,231,232,233,234,235,236,237,238,239,240,241,242,243,244,245,246,247,248,249,250,251,252,253,254,255,256,257,258,259,260,261,262,263,264,265,266,267,268,269,270,271,272,273,274,275,276,277,278,279,280,281,282,283,284,285,286,287,288,289,290,291,292,293,294,295,296,297,298,299,300,301,302,303,304,305,306,307,308,309,310,311,312,313,314,315,316,317,318,319,320,321,322,323,324,325,326,327,328,329,330,331,332,333,334,335,336,337,338 --> row.names NOT used
> p2 <- biplotRes(object=o2plsRes,type="common",comps=c(1,2),
+ block="mirna",title=NULL,colorCol="classname",
+ sizeValues=c(2,4),shapeValues=c(17,0),
+ background=TRUE,pointSize=4,labelSize=NULL,
+ axisSize=NULL,titleSize=NULL)
Warning message:
In data.row.names(row.names, rowsi, i) :
some row.names duplicated: 170,171,172,173,174,175,176,177,178,179,180,181,182,183,184,185,186,187,188,189,190,191,192,193,194,195,196,197,198,199,200,201,202,203,204,205,206,207,208,209,210,211,212,213,214,215,216,217,218,219,220,221,222,223,224,225,226,227,228,229,230,231,232,233,234,235,236,237,238,239,240,241,242,243,244,245,246,247,248,249,250,251,252,253,254,255,256,257,258,259,260,261,262,263,264,265,266,267,268,269,270,271,272,273,274,275,276,277,278,279,280,281,282,283,284,285,286,287,288,289,290,291,292,293,294,295,296,297,298,299,300,301,302,303,304,305,306,307,308,309,310,311,312,313,314,315,316,317,318,319,320,321,322,323,324,325,326,327,328,329,330,331,332,333,334,335,336,337,338 --> row.names NOT used
>
> # Biplot distinctive part. O2PLS
>
> p1 <- biplotRes(object=discoRes,type="individual",comps=c(1,2),
+ block="expr",title=NULL,colorCol="classname",
+ sizeValues=c(2,4),shapeValues=c(17,0),
+ background=TRUE,pointSize=4,labelSize=NULL,
+ axisSize=NULL,titleSize=NULL)
Warning message:
In data.row.names(row.names, rowsi, i) :
some row.names duplicated: 170,171,172,173,174,175,176,177,178,179,180,181,182,183,184,185,186,187,188,189,190,191,192,193,194,195,196,197,198,199,200,201,202,203,204,205,206,207,208,209,210,211,212,213,214,215,216,217,218,219,220,221,222,223,224,225,226,227,228,229,230,231,232,233,234,235,236,237,238,239,240,241,242,243,244,245,246,247,248,249,250,251,252,253,254,255,256,257,258,259,260,261,262,263,264,265,266,267,268,269,270,271,272,273,274,275,276,277,278,279,280,281,282,283,284,285,286,287,288,289,290,291,292,293,294,295,296,297,298,299,300,301,302,303,304,305,306,307,308,309,310,311,312,313,314,315,316,317,318,319,320,321,322,323,324,325,326,327,328,329,330,331,332,333,334,335,336,337,338 --> row.names NOT used
> p2 <- biplotRes(object=discoRes,type="individual",comps=c(1,2),
+ block="mirna",title=NULL,colorCol="classname",
+ sizeValues=c(2,4),shapeValues=c(17,0),
+ background=TRUE,pointSize=4,labelSize=NULL,
+ axisSize=NULL,titleSize=NULL)
Warning message:
In data.row.names(row.names, rowsi, i) :
some row.names duplicated: 170,171,172,173,174,175,176,177,178,179,180,181,182,183,184,185,186,187,188,189,190,191,192,193,194,195,196,197,198,199,200,201,202,203,204,205,206,207,208,209,210,211,212,213,214,215,216,217,218,219,220,221,222,223,224,225,226,227,228,229,230,231,232,233,234,235,236,237,238,239,240,241,242,243,244,245,246,247,248,249,250,251,252,253,254,255,256,257,258,259,260,261,262,263,264,265,266,267,268,269,270,271,272,273,274,275,276,277,278,279,280,281,282,283,284,285,286,287,288,289,290,291,292,293,294,295,296,297,298,299,300,301,302,303,304,305,306,307,308,309,310,311,312,313,314,315,316,317,318,319,320,321,322,323,324,325,326,327,328,329,330,331,332,333,334,335,336,337,338 --> row.names NOT used
>
>
>
>
>
> dev.off()
null device
1
>
 .
.