If combined=FALSE, it indicates the x and y components of the type and block chosen. If combined=TRUE, it indicates the component to plot for the first block of information and the component for the second block of information to plot together. By default the components are set to c(1,2) if combined=FALSE and to c(1,1) if combined=TRUE.
what
Either "scores" or "loadings"
type
Either "common", "individual" or "both"
combined
Logical indicating whether to make a simple plot of two components from one block, or components from different blocks
block
Which block to plot, either "1" or "2" or the name of the block.
color
Character specifying a pData column from the original data to use to color points
shape
Character specifying a pData column to select point shape
labels
Character specifying a pData column from which to take point labels
background
Logical specifying whether to make a grey background
palette
Vector giving the color palette for the plot
pointSize
Size of plot points
labelSize
Size of point labels if not NULL
axisSize
Size of axis text
titleSize
Size of title text
Value
ggplot object
Author(s)
Patricia Sebastian-Leon
Examples
data("STATegRa_S3")
B1 <- createOmicsExpressionSet(Data=Block1.PCA,pData=ed.PCA,
pDataDescr=c("classname"))
B2 <- createOmicsExpressionSet(Data=Block2.PCA,
pData=ed.PCA,pDataDescr=c("classname"))
# Omics components analysis
discoRes <- omicsCompAnalysis(Input=list(B1,B2),Names=c("expr","mirna"),
method="DISCOSCA",Rcommon=2,Rspecific=c(2,2),
center=TRUE,scale=TRUE,weight=TRUE)
jiveRes <- omicsCompAnalysis(Input=list(B1,B2),Names=c("expr","mirna"),
method="JIVE",Rcommon=2,Rspecific=c(2,2),
center=TRUE,scale=TRUE,weight=TRUE)
o2plsRes <- omicsCompAnalysis(Input=list(B1,B2),Names=c("expr","mirna"),
method="O2PLS",Rcommon=2,Rspecific=c(2,2),
center=TRUE,scale=TRUE,weight=TRUE)
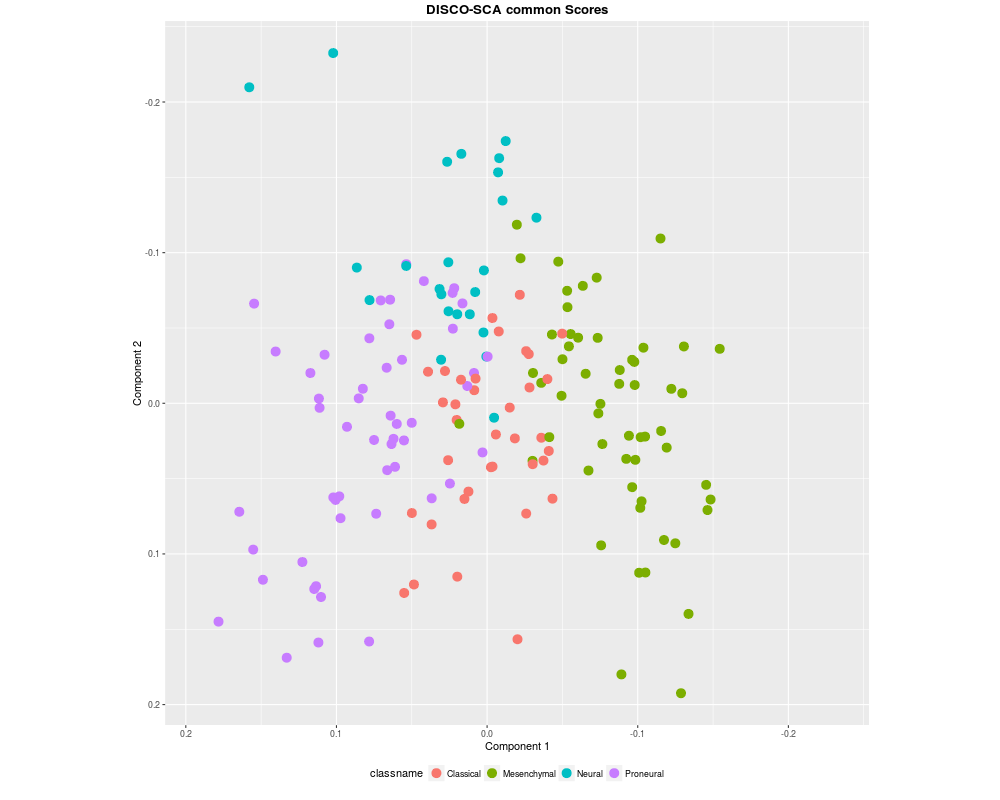
# Scatterplot of scores variables associated to common components
# DISCO-SCA
plotRes(object=discoRes,comps=c(1,2),what="scores",type="common",
combined=FALSE,block="",color="classname",shape=NULL,labels=NULL,
background=TRUE,palette=NULL,pointSize=4,labelSize=NULL,
axisSize=NULL,titleSize=NULL)
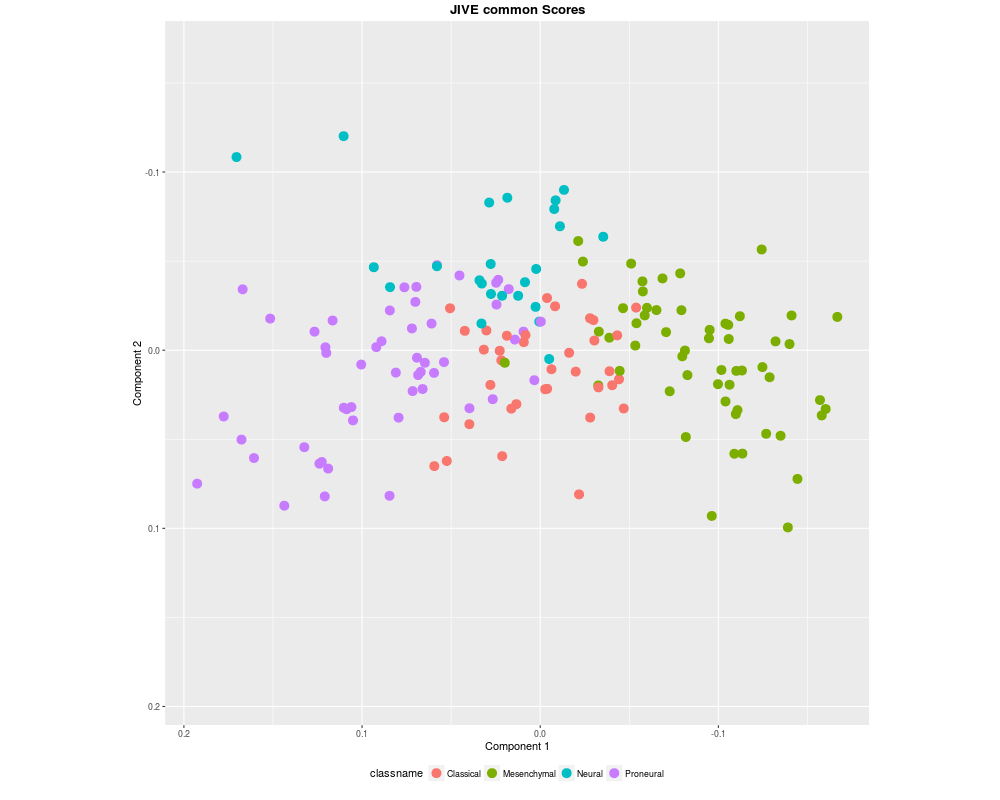
# JIVE
plotRes(object=jiveRes,comps=c(1,2),what="scores",type="common",
combined=FALSE,block="",color="classname",shape=NULL,labels=NULL,
background=TRUE,palette=NULL,pointSize=4,labelSize=NULL,
axisSize=NULL,titleSize=NULL)
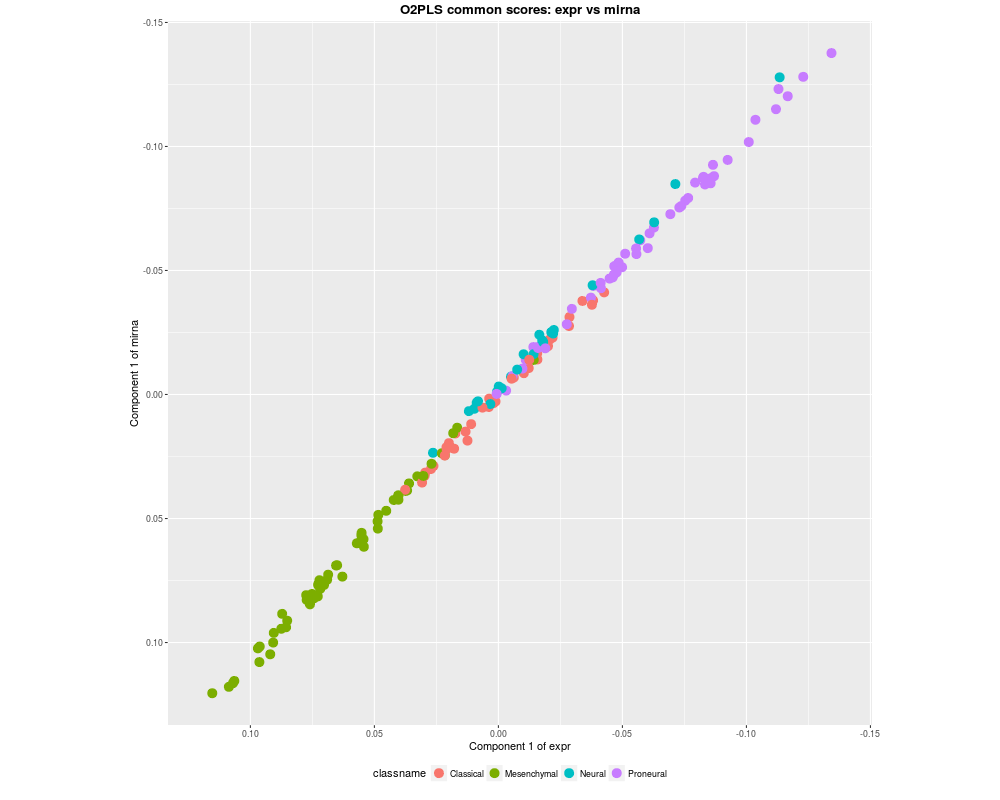
# O2PLS
# Scatterplot of scores variables associated to common components
# Associated to first block
p1 <- plotRes(object=o2plsRes,comps=c(1,2),what="scores",type="common",
combined=FALSE,block="expr",color="classname",shape=NULL,
labels=NULL,background=TRUE,palette=NULL,pointSize=4,
labelSize=NULL,axisSize=NULL,titleSize=NULL)
# Associated to second block
p2 <- plotRes(object=o2plsRes,comps=c(1,2),what="scores",type="common",
combined=FALSE,block="mirna",color="classname",shape=NULL,
labels=NULL,background=TRUE,palette=NULL,pointSize=4,
labelSize=NULL,axisSize=NULL,titleSize=NULL)
# Combined plot of scores variables assocaited to common components
plotRes(object=o2plsRes,comps=c(1,1),what="scores",type="common",
combined=TRUE,block="",color="classname",shape=NULL,
labels=NULL,background=TRUE,palette=NULL,pointSize=4,
labelSize=NULL,axisSize=NULL,titleSize=NULL)
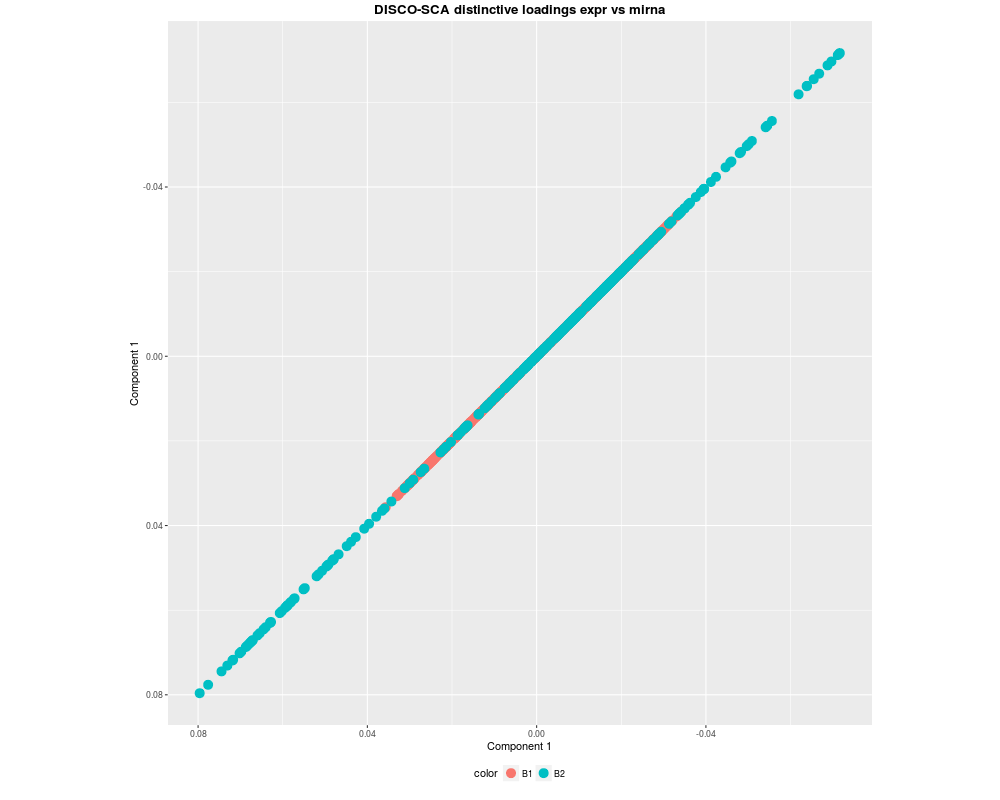
# Loadings plot for individual components
# Separately for each block
p1 <- plotRes(object=discoRes,comps=c(1,2),what="loadings",type="individual",
combined=FALSE,block="expr",color="classname",shape=NULL,
labels=NULL,background=TRUE,palette=NULL,pointSize=4,
labelSize=NULL,axisSize=NULL,titleSize=NULL)
p2 <- plotRes(object=discoRes,comps=c(1,2),what="loadings",type="individual",
combined=FALSE,block="mirna",color="classname",shape=NULL,
labels=NULL,background=TRUE,palette=NULL,pointSize=4,
labelSize=NULL,axisSize=NULL,titleSize=NULL)
# Combined plot
plotRes(object=discoRes,comps=c(1,1),what="loadings",type="individual",
combined=TRUE,block="",color="classname",shape=NULL,
labels=NULL,background=TRUE,palette=NULL,pointSize=4,
labelSize=NULL,axisSize=NULL,titleSize=NULL)
Results
R version 3.3.1 (2016-06-21) -- "Bug in Your Hair"
Copyright (C) 2016 The R Foundation for Statistical Computing
Platform: x86_64-pc-linux-gnu (64-bit)

R is free software and comes with ABSOLUTELY NO WARRANTY.
You are welcome to redistribute it under certain conditions.
Type 'license()' or 'licence()' for distribution details.

R is a collaborative project with many contributors.
Type 'contributors()' for more information and
'citation()' on how to cite R or R packages in publications.

Type 'demo()' for some demos, 'help()' for on-line help, or
'help.start()' for an HTML browser interface to help.
Type 'q()' to quit R.

> library(STATegRa)
Warning message:
replacing previous import 'Biobase::combine' by 'gridExtra::combine' when loading 'STATegRa'
> png(filename="/home/ddbj/snapshot/RGM3/R_BC/result/STATegRa/plotRes.Rd_%03d_medium.png", width=480, height=480)
> ### Name: plotRes
> ### Title: Plot component analysis results
> ### Aliases: plotRes
> ###   plotRes,caClass,numeric,character,character,logical,character-method
>
> ### ** Examples
>
> data("STATegRa_S3")
> B1 <- createOmicsExpressionSet(Data=Block1.PCA,pData=ed.PCA,
+                                pDataDescr=c("classname"))
> B2 <- createOmicsExpressionSet(Data=Block2.PCA,
+                                pData=ed.PCA,pDataDescr=c("classname"))
> # Omics components analysis
> discoRes <- omicsCompAnalysis(Input=list(B1,B2),Names=c("expr","mirna"),
+                               method="DISCOSCA",Rcommon=2,Rspecific=c(2,2),
+                               center=TRUE,scale=TRUE,weight=TRUE)
> jiveRes <- omicsCompAnalysis(Input=list(B1,B2),Names=c("expr","mirna"),
+                              method="JIVE",Rcommon=2,Rspecific=c(2,2),
+                              center=TRUE,scale=TRUE,weight=TRUE)
>
> o2plsRes <- omicsCompAnalysis(Input=list(B1,B2),Names=c("expr","mirna"),
+                               method="O2PLS",Rcommon=2,Rspecific=c(2,2),
+                               center=TRUE,scale=TRUE,weight=TRUE)
>
> # Scatterplot of scores variables associated to common components
>
> # DISCO-SCA
> plotRes(object=discoRes,comps=c(1,2),what="scores",type="common",
+         combined=FALSE,block="",color="classname",shape=NULL,labels=NULL,
+         background=TRUE,palette=NULL,pointSize=4,labelSize=NULL,
+         axisSize=NULL,titleSize=NULL)
> # JIVE
> plotRes(object=jiveRes,comps=c(1,2),what="scores",type="common",
+        combined=FALSE,block="",color="classname",shape=NULL,labels=NULL,
+         background=TRUE,palette=NULL,pointSize=4,labelSize=NULL,
+         axisSize=NULL,titleSize=NULL)
>
> # O2PLS
> # Scatterplot of scores variables associated to common components
> # Associated to first block
> p1 <- plotRes(object=o2plsRes,comps=c(1,2),what="scores",type="common",
+               combined=FALSE,block="expr",color="classname",shape=NULL,
+               labels=NULL,background=TRUE,palette=NULL,pointSize=4,
+               labelSize=NULL,axisSize=NULL,titleSize=NULL)
> # Associated to second block
> p2 <- plotRes(object=o2plsRes,comps=c(1,2),what="scores",type="common",
+               combined=FALSE,block="mirna",color="classname",shape=NULL,
+               labels=NULL,background=TRUE,palette=NULL,pointSize=4,
+               labelSize=NULL,axisSize=NULL,titleSize=NULL)
>
> # Combined plot of scores variables assocaited to common components
> plotRes(object=o2plsRes,comps=c(1,1),what="scores",type="common",
+         combined=TRUE,block="",color="classname",shape=NULL,
+         labels=NULL,background=TRUE,palette=NULL,pointSize=4,
+         labelSize=NULL,axisSize=NULL,titleSize=NULL)
>
> # Loadings plot for individual components
> # Separately for each block
> p1 <- plotRes(object=discoRes,comps=c(1,2),what="loadings",type="individual",
+               combined=FALSE,block="expr",color="classname",shape=NULL,
+               labels=NULL,background=TRUE,palette=NULL,pointSize=4,
+               labelSize=NULL,axisSize=NULL,titleSize=NULL)
> p2 <- plotRes(object=discoRes,comps=c(1,2),what="loadings",type="individual",
+               combined=FALSE,block="mirna",color="classname",shape=NULL,
+               labels=NULL,background=TRUE,palette=NULL,pointSize=4,
+               labelSize=NULL,axisSize=NULL,titleSize=NULL)
>
> # Combined plot
> plotRes(object=discoRes,comps=c(1,1),what="loadings",type="individual",
+         combined=TRUE,block="",color="classname",shape=NULL,
+         labels=NULL,background=TRUE,palette=NULL,pointSize=4,
+         labelSize=NULL,axisSize=NULL,titleSize=NULL)
>
>
>
>
>
> dev.off()
null device
          1
>
 .
.