Supported by Dr. Osamu Ogasawara and  . . |
|
Last data update: 2014.03.03 |
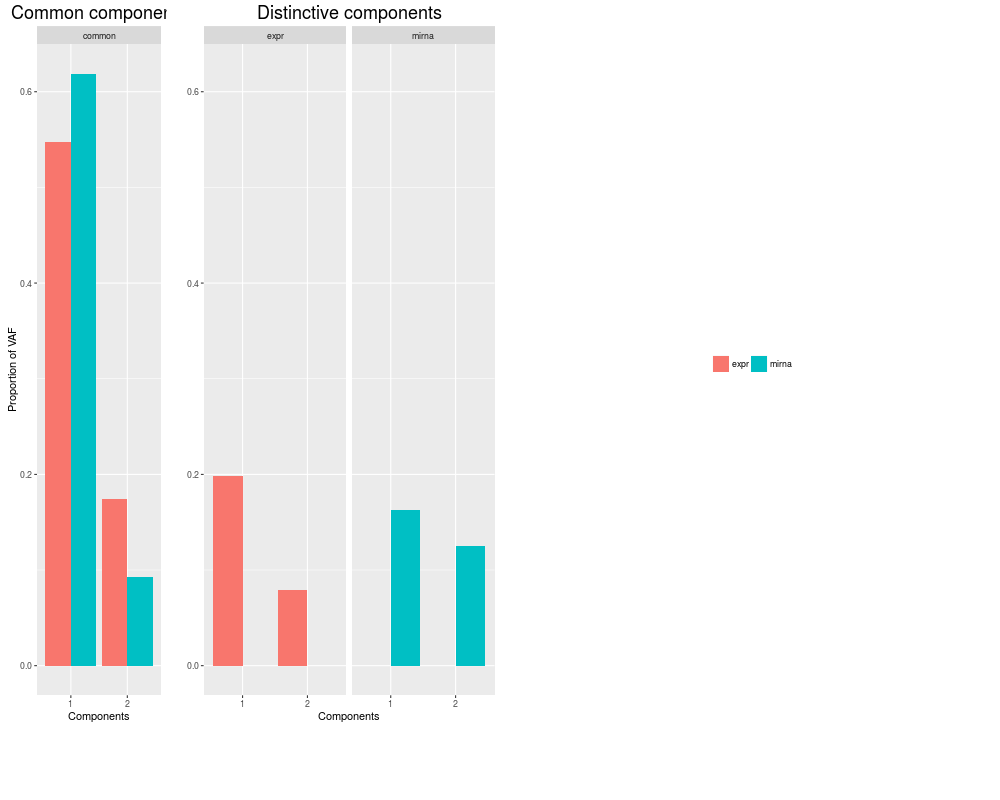
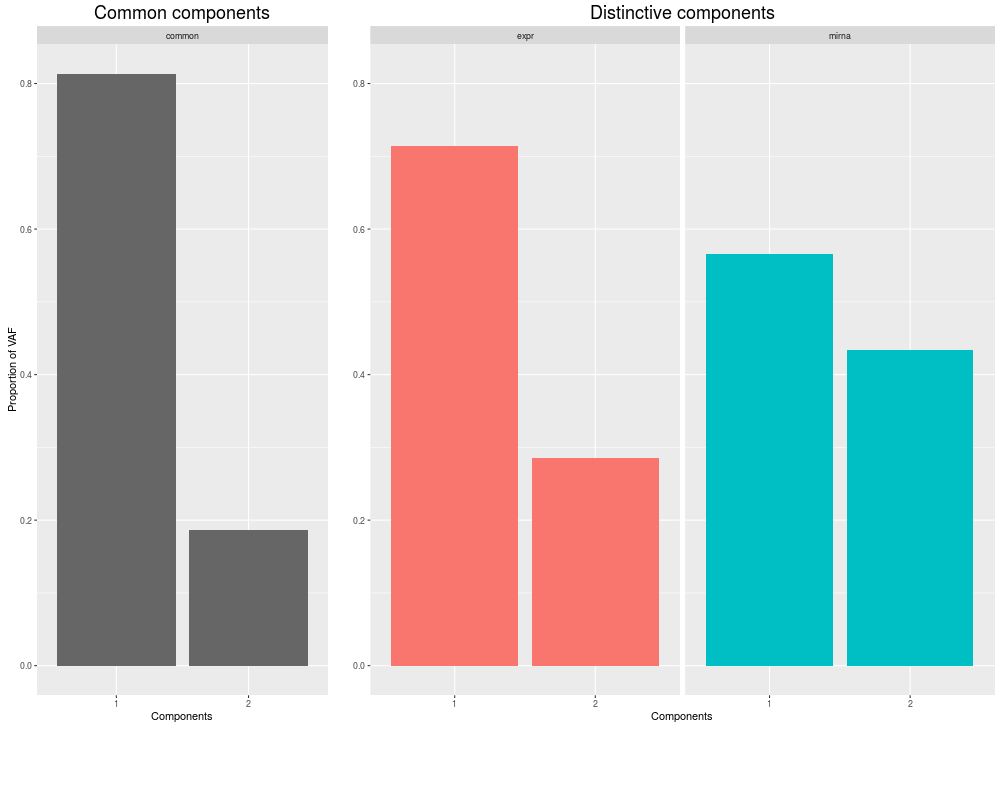
Plot VAF (Variance Explained For) from Component AnalysisDescriptionThis function visualises the VAF results from component analysis. The input is a UsageplotVAF(object, mainTitle="") Arguments
Value
Author(s)Patricia Sebastian-Leon Examples
data("STATegRa_S3")
require(ggplot2)
B1 <- createOmicsExpressionSet(Data=Block1.PCA,pData=ed.PCA,
                               pDataDescr=c("classname"))
B2 <- createOmicsExpressionSet(Data=Block2.PCA,
                               pData=ed.PCA,pDataDescr=c("classname"))
# Omics components analysis
discoRes <- omicsCompAnalysis(Input=list(B1,B2),Names=c("expr","mirna"),
                              method="DISCOSCA",Rcommon=2,Rspecific=c(2,2),
                              center=TRUE,scale=TRUE,weight=TRUE)
jiveRes <- omicsCompAnalysis(Input=list(B1,B2),Names=c("expr","mirna"),
                             method="JIVE",Rcommon=2,Rspecific=c(2,2),
                             center=TRUE,scale=TRUE,weight=TRUE)

# DISCO-SCA plotVAF
plotVAF(discoRes)

# JIVE plotVAF
plotVAF(jiveRes)
Results
R version 3.3.1 (2016-06-21) -- "Bug in Your Hair"
Copyright (C) 2016 The R Foundation for Statistical Computing
Platform: x86_64-pc-linux-gnu (64-bit)

R is free software and comes with ABSOLUTELY NO WARRANTY.
You are welcome to redistribute it under certain conditions.
Type 'license()' or 'licence()' for distribution details.

R is a collaborative project with many contributors.
Type 'contributors()' for more information and
'citation()' on how to cite R or R packages in publications.

Type 'demo()' for some demos, 'help()' for on-line help, or
'help.start()' for an HTML browser interface to help.
Type 'q()' to quit R.

> library(STATegRa)
Warning message:
replacing previous import 'Biobase::combine' by 'gridExtra::combine' when loading 'STATegRa'
> png(filename="/home/ddbj/snapshot/RGM3/R_BC/result/STATegRa/plotVAF.Rd_%03d_medium.png", width=480, height=480)
> ### Name: plotVAF
> ### Title: Plot VAF (Variance Explained For) from Component Analysis
> ### Aliases: plotVAF plotVAF,caClass-method
>
> ### ** Examples
>
> data("STATegRa_S3")
> require(ggplot2)
Loading required package: ggplot2
> B1 <- createOmicsExpressionSet(Data=Block1.PCA,pData=ed.PCA,
+                                pDataDescr=c("classname"))
> B2 <- createOmicsExpressionSet(Data=Block2.PCA,
+                                pData=ed.PCA,pDataDescr=c("classname"))
> # Omics components analysis
> discoRes <- omicsCompAnalysis(Input=list(B1,B2),Names=c("expr","mirna"),
+                               method="DISCOSCA",Rcommon=2,Rspecific=c(2,2),
+                               center=TRUE,scale=TRUE,weight=TRUE)
> jiveRes <- omicsCompAnalysis(Input=list(B1,B2),Names=c("expr","mirna"),
+                              method="JIVE",Rcommon=2,Rspecific=c(2,2),
+                              center=TRUE,scale=TRUE,weight=TRUE)
>
> # DISCO-SCA plotVAF
> plotVAF(discoRes)
>
> # JIVE plotVAF
> plotVAF(jiveRes)
>
>
>
>
>
> dev.off()
null device
          1
>
|

Created & Maintained by Osamu Ogasawara (osamu.ogasawara@gmail.com) and 