Supported by Dr. Osamu Ogasawara and  . . |
|
Last data update: 2014.03.03 |
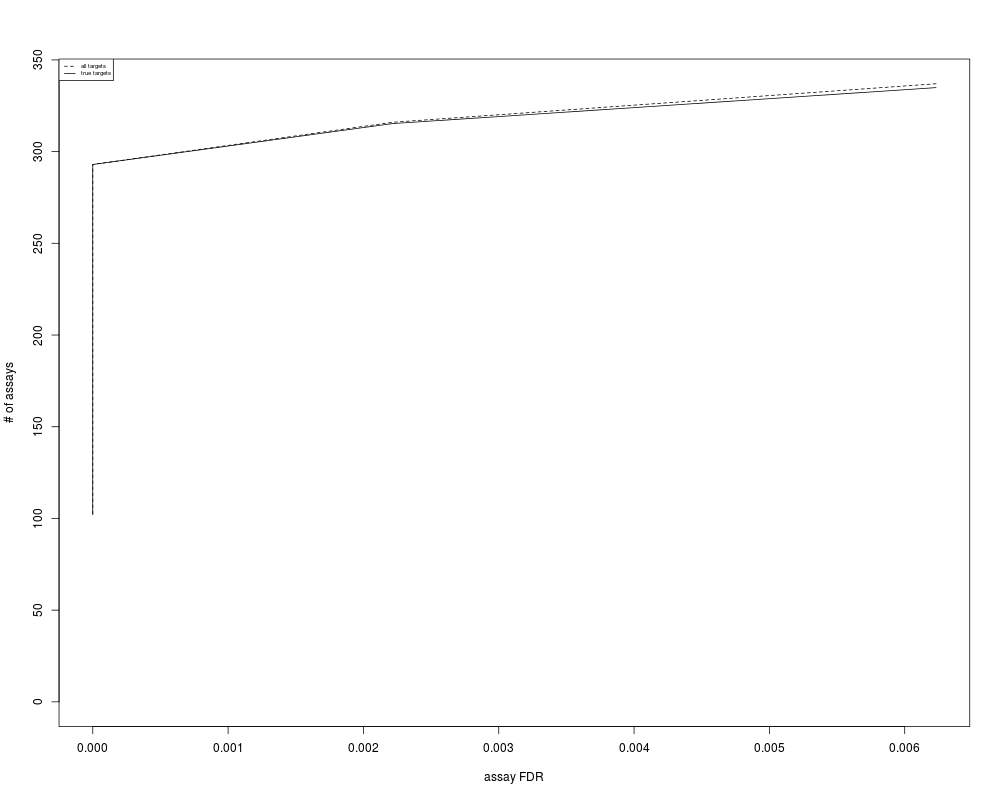
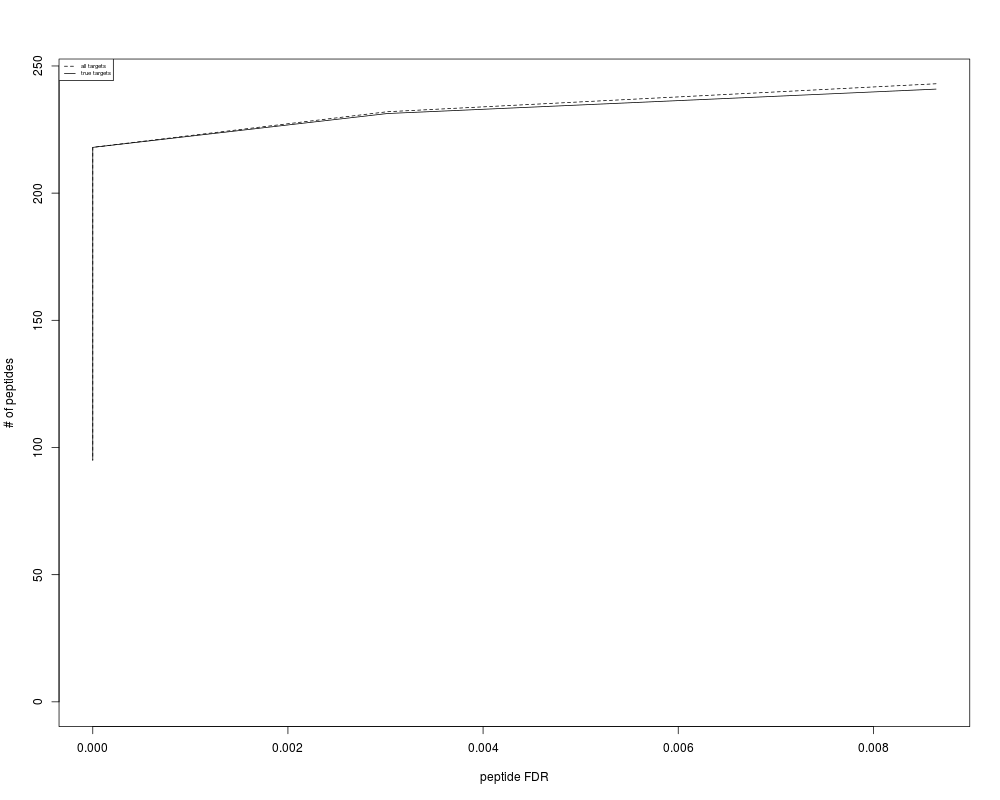
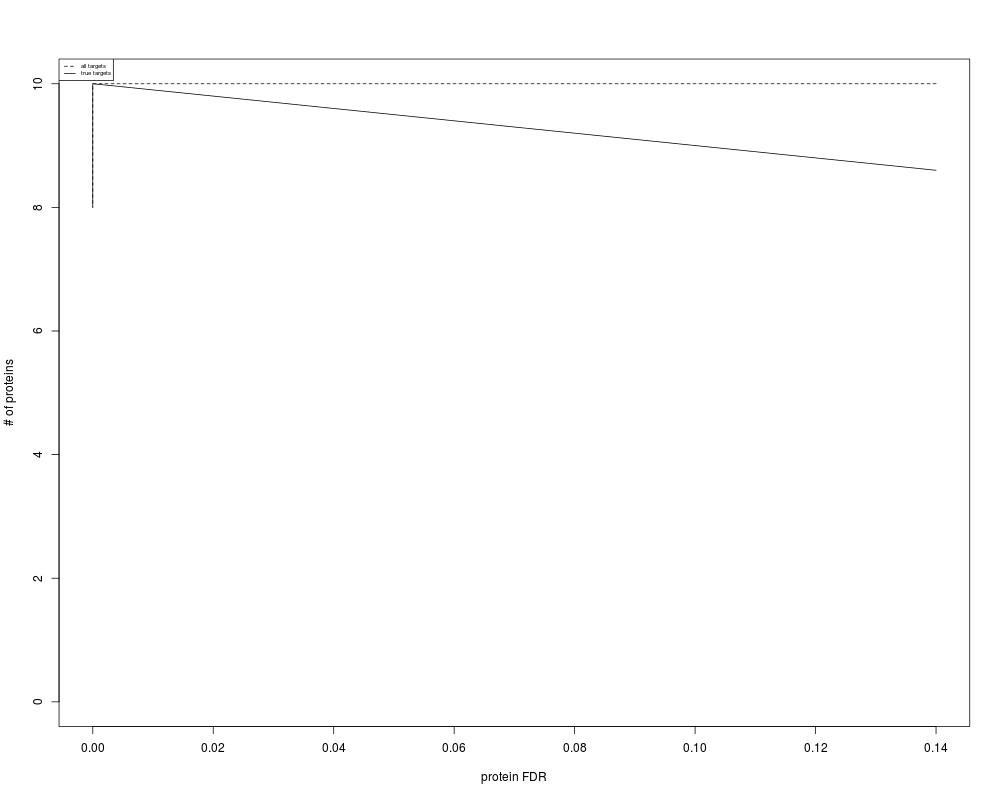
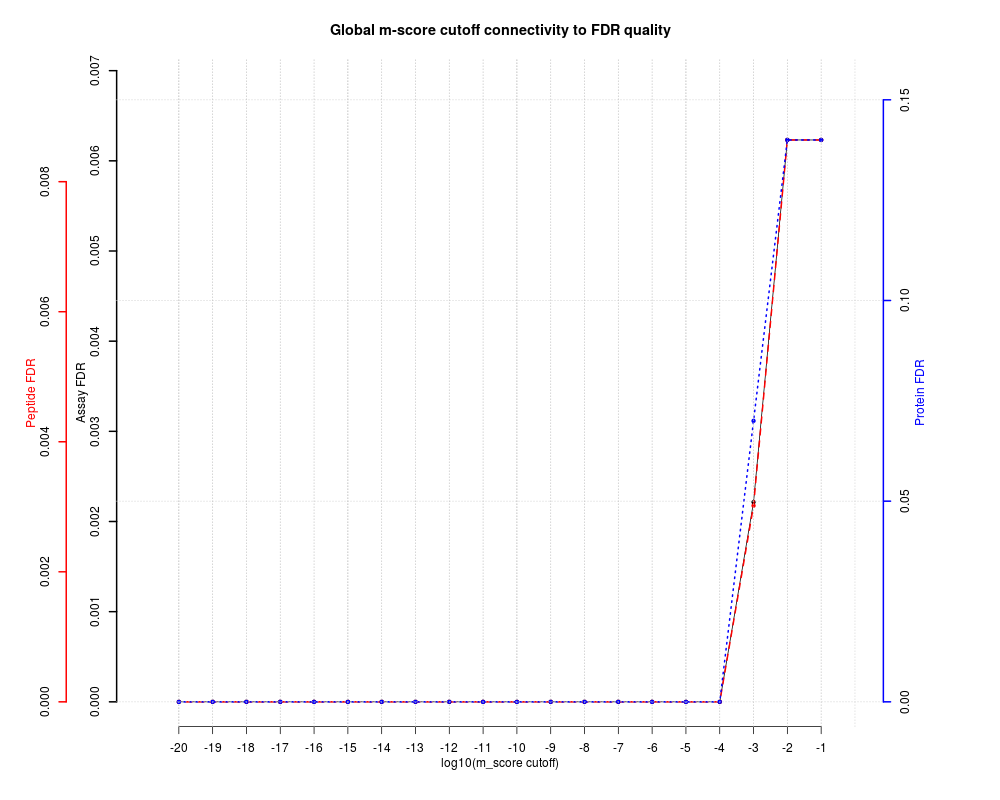
Assess overall FDR in annotated OpenSWATH/pyProphet output table in dependence of m_score cutoffDescriptionThis function estimates the assay, peptide and protein FDR over a multi-run OpenSWATH/pyProphet output table. It counts target and decoy assays (unique transition_group_id), peptides (unique FullPeptideName) and proteins (unique ProteinName) in dependence of the m-score cutoff (1e-2 to 1e-20). To arrive from decoy counts at an estimation of the false discovery rate (false positives among the targets remaining at a given mscore cutoff) the ratio of false positives to true negatives (decoys) (FFT) must be supplied. It is estimated for each run individually by pyProphet and contained in the pyProphet statistics [Injection_name]_full_stat.csv. As an approximation, the FFTs of multiple runs are averaged and supplied as argument FFT. For further details see the Vignette Section 1.3 and 4.1. Protein FDR control on peak group quality level is a very strict filter and should be handled with caution. FDR is calculated as FDR = (TN*FFT/T); TN=decoys, T=targets, FFT=see above Usageassess_fdr_overall(data, FFT, n.range = 20, output = "pdf_csv", plot = TRUE, filename="FDR_report_overall") Arguments
ValueReturns a list of class "fdr_table". If output "pdf_csv" and plot = TRUE were chosen, report files are written to the working folder. Author(s)Moritz Heusel Examples
data("OpenSWATH_data", package="SWATH2stats")
data("Study_design", package="SWATH2stats")
data <- sample_annotation(OpenSWATH_data, Study_design)
assess_fdr_overall(data, FFT=0.7, output = "Rconsole", plot = TRUE,
filename="Testoutput_assess_fdr_overall")
Results
R version 3.3.1 (2016-06-21) -- "Bug in Your Hair"
Copyright (C) 2016 The R Foundation for Statistical Computing
Platform: x86_64-pc-linux-gnu (64-bit)

R is free software and comes with ABSOLUTELY NO WARRANTY.
You are welcome to redistribute it under certain conditions.
Type 'license()' or 'licence()' for distribution details.

R is a collaborative project with many contributors.
Type 'contributors()' for more information and
'citation()' on how to cite R or R packages in publications.

Type 'demo()' for some demos, 'help()' for on-line help, or
'help.start()' for an HTML browser interface to help.
Type 'q()' to quit R.

> library(SWATH2stats)
> png(filename="/home/ddbj/snapshot/RGM3/R_BC/result/SWATH2stats/assess_fdr_overall.Rd_%03d_medium.png", width=480, height=480)
> ### Name: assess_fdr_overall
> ### Title: Assess overall FDR in annotated OpenSWATH/pyProphet output table
> ###   in dependence of m_score cutoff
> ### Aliases: assess_fdr_overall
>
> ### ** Examples
>
> data("OpenSWATH_data", package="SWATH2stats")
> data("Study_design", package="SWATH2stats")
> data <- sample_annotation(OpenSWATH_data, Study_design)
> assess_fdr_overall(data, FFT=0.7, output = "Rconsole", plot = TRUE,
+ filename="Testoutput_assess_fdr_overall")
$mscore_cutoff
 [1] 1e-01 1e-02 1e-03 1e-04 1e-05 1e-06 1e-07 1e-08 1e-09 1e-10 1e-11 1e-12
[13] 1e-13 1e-14 1e-15 1e-16 1e-17 1e-18 1e-19 1e-20

$target.assays
 [1] 337 337 316 293 278 255 238 218 195 179 155 143 126 108 102 102 102 102 102
[20] 102

$decoy.assays
 [1] 3 3 1 0 0 0 0 0 0 0 0 0 0 0 0 0 0 0 0 0

$assay.fdr
 [1] 0.006231454 0.006231454 0.002215190 0.000000000 0.000000000 0.000000000
 [7] 0.000000000 0.000000000 0.000000000 0.000000000 0.000000000 0.000000000
[13] 0.000000000 0.000000000 0.000000000 0.000000000 0.000000000 0.000000000
[19] 0.000000000 0.000000000

$true.target.assays
 [1] 334.9 334.9 315.3 293.0 278.0 255.0 238.0 218.0 195.0 179.0 155.0 143.0
[13] 126.0 108.0 102.0 102.0 102.0 102.0 102.0 102.0

$target.peptides
 [1] 243 243 232 218 211 196 188 181 164 154 135 129 116  99  95  95  95  95  95
[20]  95

$decoy.peptides
 [1] 3 3 1 0 0 0 0 0 0 0 0 0 0 0 0 0 0 0 0 0

$peptide.fdr
 [1] 0.008641975 0.008641975 0.003017241 0.000000000 0.000000000 0.000000000
 [7] 0.000000000 0.000000000 0.000000000 0.000000000 0.000000000 0.000000000
[13] 0.000000000 0.000000000 0.000000000 0.000000000 0.000000000 0.000000000
[19] 0.000000000 0.000000000

$true.target.peptides
 [1] 240.9 240.9 231.3 218.0 211.0 196.0 188.0 181.0 164.0 154.0 135.0 129.0
[13] 116.0  99.0  95.0  95.0  95.0  95.0  95.0  95.0

$target.proteins
 [1] 10 10 10 10 10 10 10 10 10 10  9  9  9  9  8  8  8  8  8  8

$decoy.proteins
 [1] 2 2 1 0 0 0 0 0 0 0 0 0 0 0 0 0 0 0 0 0

$protein.fdr
 [1] 0.14 0.14 0.07 0.00 0.00 0.00 0.00 0.00 0.00 0.00 0.00 0.00 0.00 0.00 0.00
[16] 0.00 0.00 0.00 0.00 0.00

$true.target.proteins
 [1]  8.6  8.6  9.3 10.0 10.0 10.0 10.0 10.0 10.0 10.0  9.0  9.0  9.0  9.0  8.0
[16]  8.0  8.0  8.0  8.0  8.0

attr(,"class")
[1] "fdr_table"
>
>
>
>
>
> dev.off()
null device
          1
>
|