Enables to set legend position, default is "none".
legend_title
Will the legend have a title?, Default is FALSE.
base_size
Overall font size. Default is 13.
horizontal
Logical. Horizontal axis lines?
base_family
Default font family.
colors
Default colors used in the plot in the following order: background, lines, text, and title.
Value
The theme.
Examples
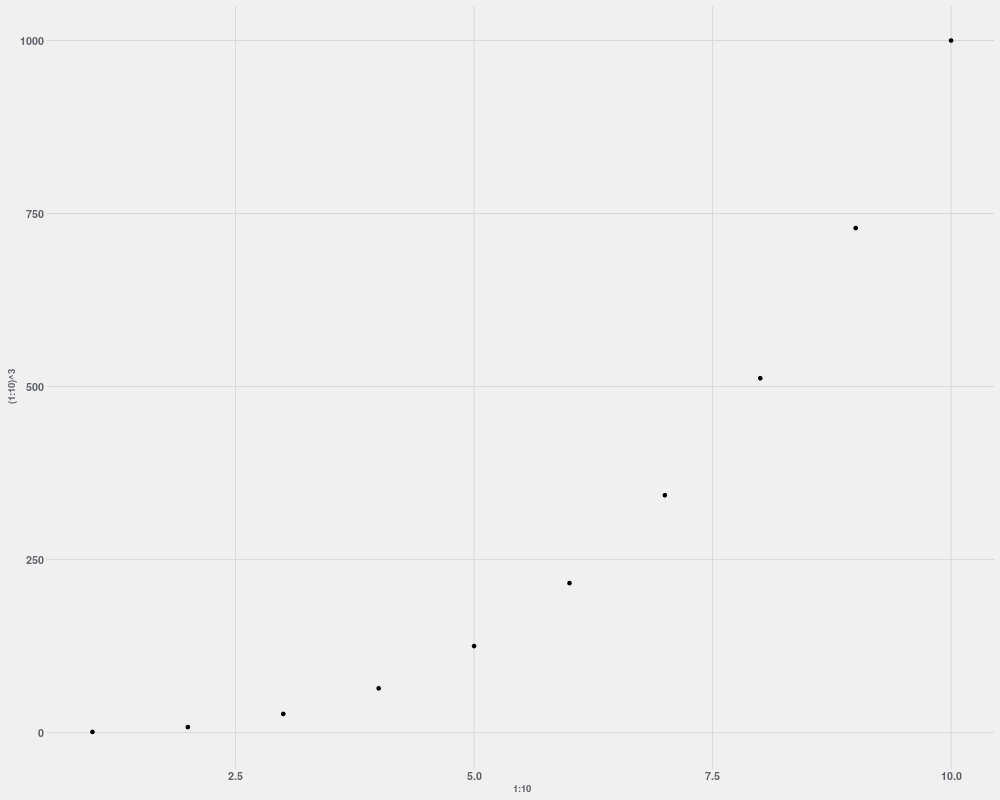
qplot(1:10, (1:10)^3) + theme_fte()
# Easy to set different theme colors:
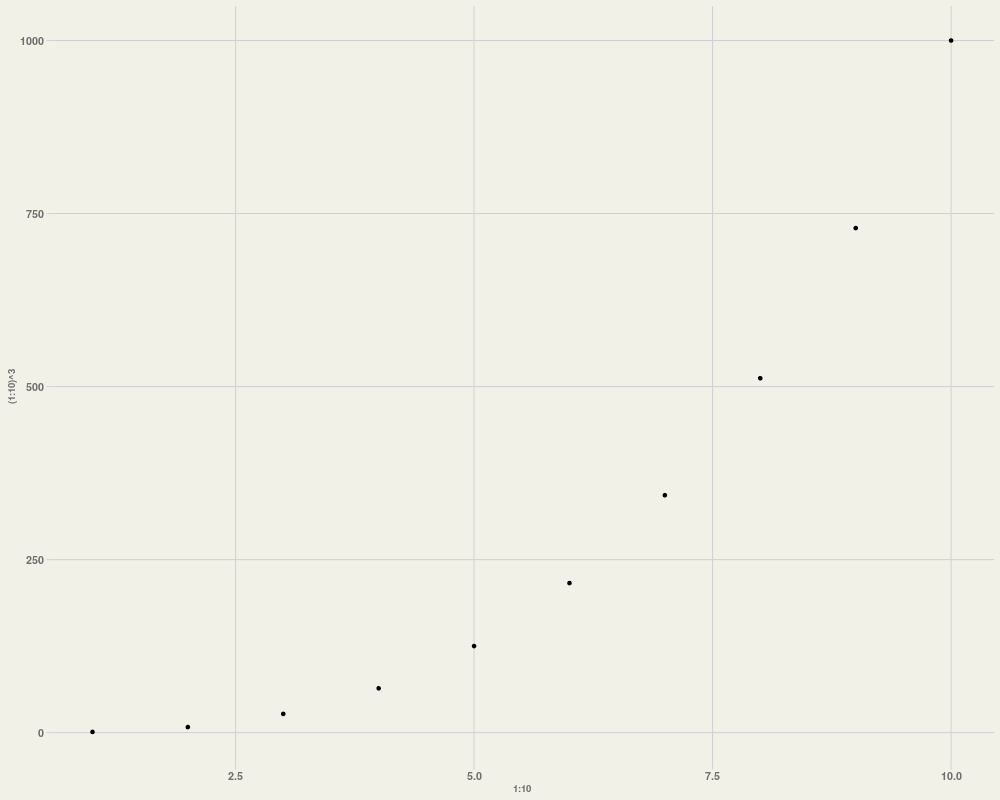
mycolors = c("#F2F1E8", "#D2D2D2", "#6E6E6E", "#6E6E6E")
qplot(1:10, (1:10)^3) +
theme_fte(colors=mycolors) #ae8b38
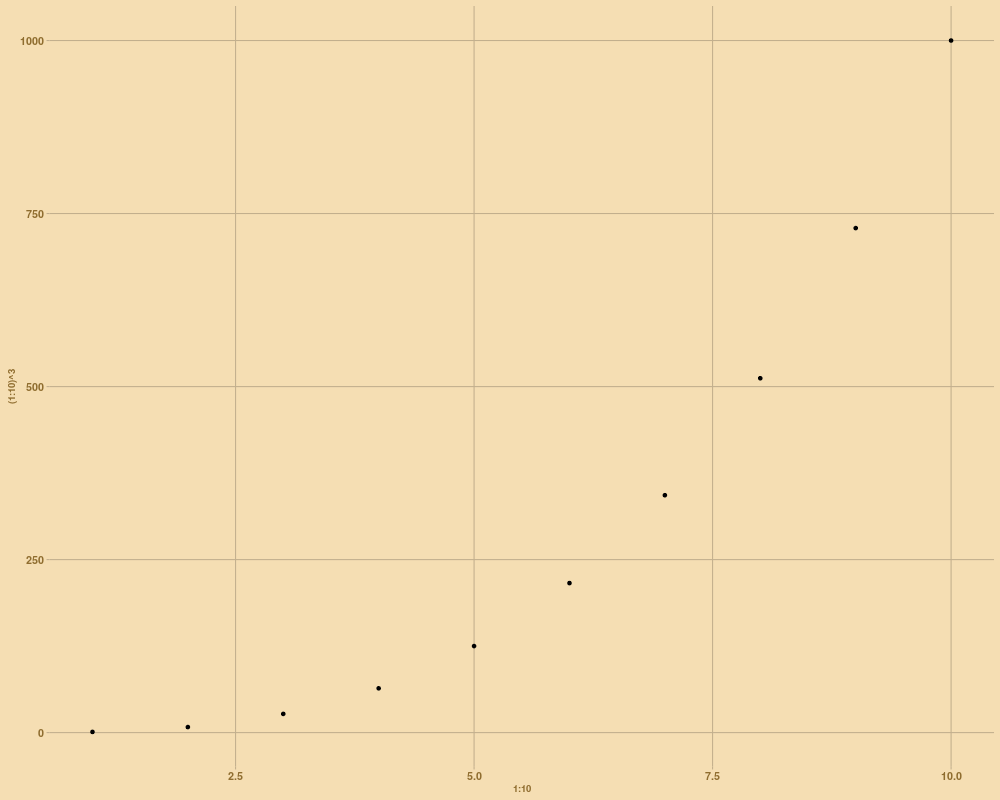
mycolors = c("wheat", "#C2AF8D", "#8F6D2F", "darkred")
qplot(1:10, (1:10)^3) +
theme_fte(colors=mycolors)
# Check that it is a complete theme
attr(theme_fte(), "complete")
Results
R version 3.3.1 (2016-06-21) -- "Bug in Your Hair"
Copyright (C) 2016 The R Foundation for Statistical Computing
Platform: x86_64-pc-linux-gnu (64-bit)

R is free software and comes with ABSOLUTELY NO WARRANTY.
You are welcome to redistribute it under certain conditions.
Type 'license()' or 'licence()' for distribution details.

R is a collaborative project with many contributors.
Type 'contributors()' for more information and
'citation()' on how to cite R or R packages in publications.

Type 'demo()' for some demos, 'help()' for on-line help, or
'help.start()' for an HTML browser interface to help.
Type 'q()' to quit R.

> library(SciencesPo)
Loading required package: ggplot2
initializing ... done

> png(filename="/home/ddbj/snapshot/RGM3/R_CC/result/SciencesPo/theme_fte.Rd_%03d_medium.png", width=480, height=480)
> ### Name: theme_fte
> ### Title: Themes for ggplot2 Graphs
> ### Aliases: theme_538 theme_fte
>
> ### ** Examples
>
> qplot(1:10, (1:10)^3) + theme_fte()
>
> # Easy to set different theme colors:
> mycolors = c("#F2F1E8",  "#D2D2D2",  "#6E6E6E", "#6E6E6E")
> qplot(1:10, (1:10)^3) +
+  theme_fte(colors=mycolors) #ae8b38
>
> mycolors = c("wheat",  "#C2AF8D",  "#8F6D2F", "darkred")
> qplot(1:10, (1:10)^3) +
+  theme_fte(colors=mycolors)
>
> # Check that it is a complete theme
> attr(theme_fte(), "complete")
[1] TRUE
>
>
>
>
>
> dev.off()
null device
          1
>
 .
.