Supported by Dr. Osamu Ogasawara and  . . |
|
Last data update: 2014.03.03 |
Influential Error DetectionDescriptionComputes the score function and identifies influential errors Usage
       sel.edit (y, ypred, wgt=rep(1,nrow(as.matrix(y ))),
                 tot=colSums(ypred * wgt), t.sel=0.01)
Arguments
DetailsThis function ranks observations ( The selection of the units to be edited because affected by an influential error ( Value
Author(s)M. Teresa Buglielli <bugliell@istat.it>, Ugo Guarnera <guarnera@istat.it> ReferencesDi Zio, M., Guarnera, U. (2013) "A Contamination Model for Selective Editing",
Journal of Official Statistics. Volume 29, Issue 4, Pages 539-555 (http://dx.doi.org/10.2478/jos-2013-0039). Buglielli, M.T., Di Zio, M., Guarnera, U. (2010) "Use of Contamination Models for Selective Editing", European Conference on Quality in Survey Statistics Q2010, Helsinki, 4-6 May 2010. Examples
# Example 1
# Parameter estimation with one contaminated variable and one covariate
data(ex1.data)
ml.par <- ml.est(y=ex1.data[,"Y1"], x=ex1.data[,"X1"])
# Detection of influential errors
sel <- sel.edit(y=ex1.data[,"Y1"], ypred=ml.par$ypred)
head(sel)
sum(sel[,"sel"])
# orders results for decreasing importance of score
sel.ord <- sel[order(sel[,"rank"]), ]
# adds columns to data
ex1.data <- cbind(ex1.data, tau=ml.par$tau, outlier=ml.par$outlier,
sel[,c("rank", "sel")])
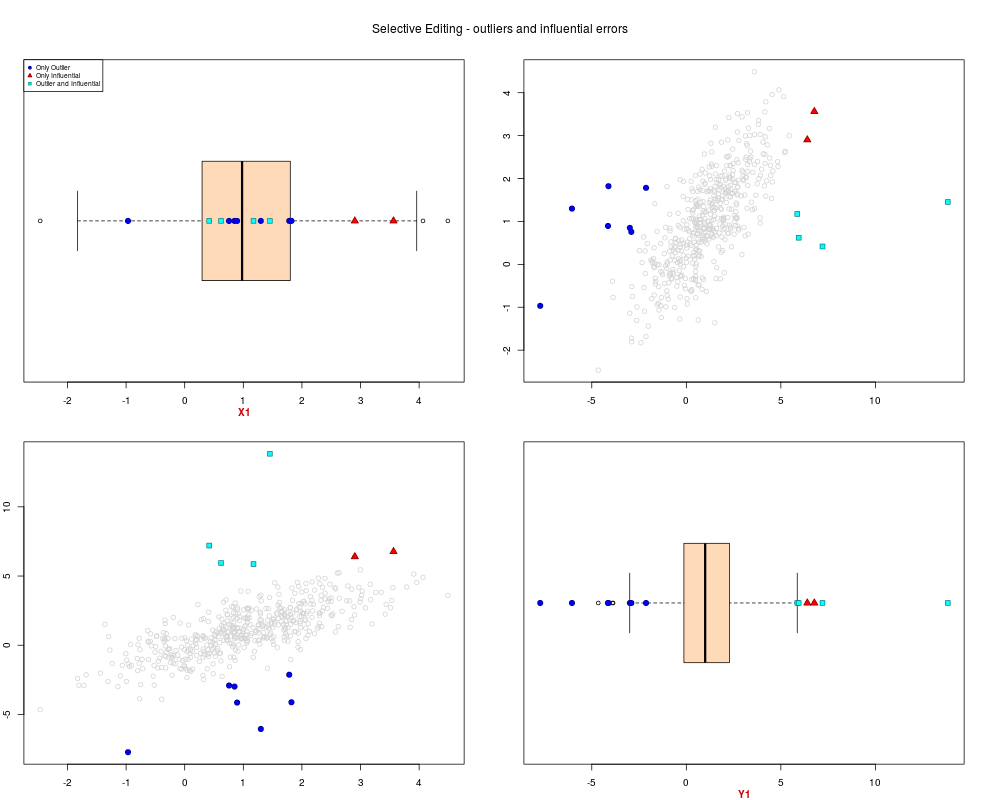
# plot of data with outliers and influential errors
sel.pairs(ex1.data[,c("X1","Y1")],outl=ml.par$outlier, sel=sel[,"sel"])
# Example 2
data(ex2.data)
ml.par <- ml.est(y=ex2.data)
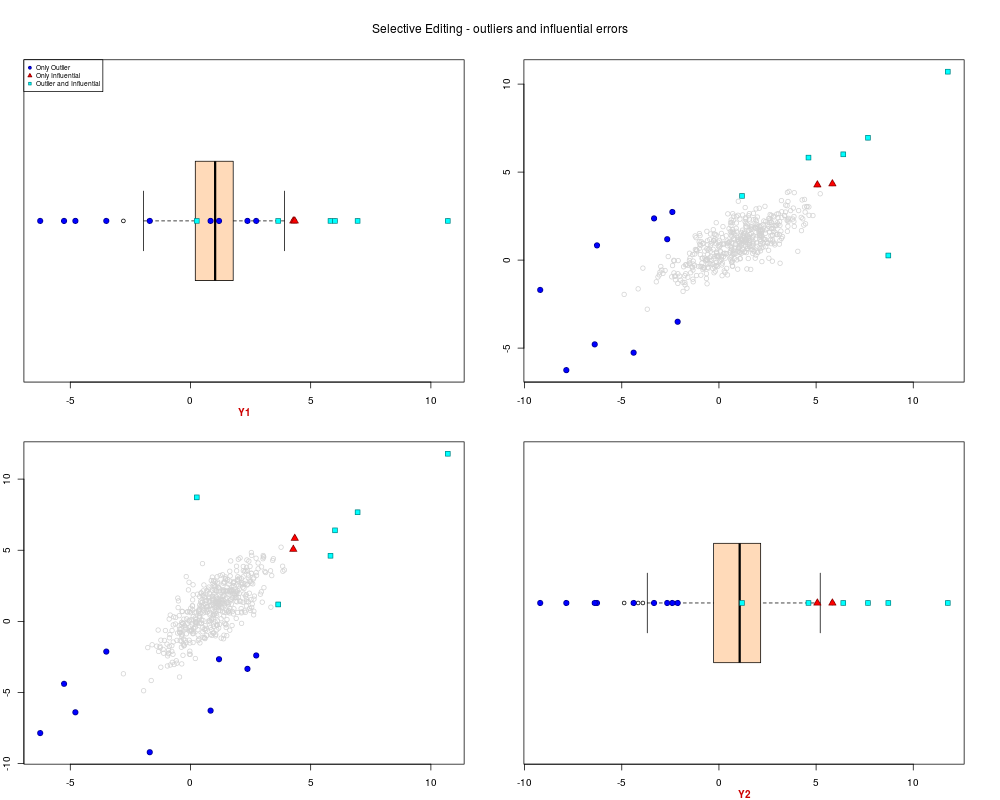
sel <- sel.edit(y=ex2.data, ypred=ml.par$ypred)
sel.pairs(ex2.data,outl=ml.par$outlier, sel=sel[,"sel"])
Results
R version 3.3.1 (2016-06-21) -- "Bug in Your Hair"
Copyright (C) 2016 The R Foundation for Statistical Computing
Platform: x86_64-pc-linux-gnu (64-bit)

R is free software and comes with ABSOLUTELY NO WARRANTY.
You are welcome to redistribute it under certain conditions.
Type 'license()' or 'licence()' for distribution details.

R is a collaborative project with many contributors.
Type 'contributors()' for more information and
'citation()' on how to cite R or R packages in publications.

Type 'demo()' for some demos, 'help()' for on-line help, or
'help.start()' for an HTML browser interface to help.
Type 'q()' to quit R.

> library(SeleMix)
Loading required package: mvtnorm
Loading required package: Ecdat
Loading required package: Ecfun

Attaching package: 'Ecfun'

The following object is masked from 'package:base':

    sign


Attaching package: 'Ecdat'

The following object is masked from 'package:datasets':

    Orange

Loading required package: xtable
> png(filename="/home/ddbj/snapshot/RGM3/R_CC/result/SeleMix/sel.edit.Rd_%03d_medium.png", width=480, height=480)
> ### Name: sel.edit
> ### Title: Influential Error Detection
> ### Aliases: sel.edit
>
> ### ** Examples
>
> # Example 1
> # Parameter estimation with one contaminated variable and one covariate
>     data(ex1.data)
>     ml.par <- ml.est(y=ex1.data[,"Y1"], x=ex1.data[,"X1"])
> # Detection of influential errors
>     sel <- sel.edit(y=ex1.data[,"Y1"], ypred=ml.par$ypred)
>     head(sel)
            y1      y1.p weights     y1.score global.score     y1.reserr y1.sel
[1,]  1.422594  1.447798       1 3.675953e-06 3.675953e-06 -1.741156e-04      0
[2,] 46.434483 45.617588       1 1.191404e-04 1.191404e-04 -2.706110e-03      0
[3,] 15.464228 15.612103       1 2.156699e-05 2.156699e-05 -1.111358e-03      0
[4,] 42.523488 41.697518       1 1.204639e-04 1.204639e-04 -2.585647e-03      0
[5,]  1.054655  1.042779       1 1.732091e-06 1.732091e-06 -3.767864e-05      0
[6,] 10.201514 10.258264       1 8.276714e-06 8.276714e-06 -5.380873e-04      0
     rank sel
[1,]  330   0
[2,]   58   0
[3,]  146   0
[4,]   57   0
[5,]  398   0
[6,]  236   0
>     sum(sel[,"sel"])
[1] 6
> # orders results for decreasing importance of score
>     sel.ord <- sel[order(sel[,"rank"]),  ]
> # adds columns to data
>     ex1.data <- cbind(ex1.data, tau=ml.par$tau, outlier=ml.par$outlier,
+                       sel[,c("rank", "sel")])
> # plot of data with outliers and influential errors
>     sel.pairs(ex1.data[,c("X1","Y1")],outl=ml.par$outlier, sel=sel[,"sel"])
> # Example 2
>     data(ex2.data)
>     ml.par <- ml.est(y=ex2.data)
>     sel <- sel.edit(y=ex2.data, ypred=ml.par$ypred)
>     sel.pairs(ex2.data,outl=ml.par$outlier, sel=sel[,"sel"])
>
>
>
>
>
> dev.off()
null device
          1
>
|