Supported by Dr. Osamu Ogasawara and  . . |
|
Last data update: 2014.03.03 |
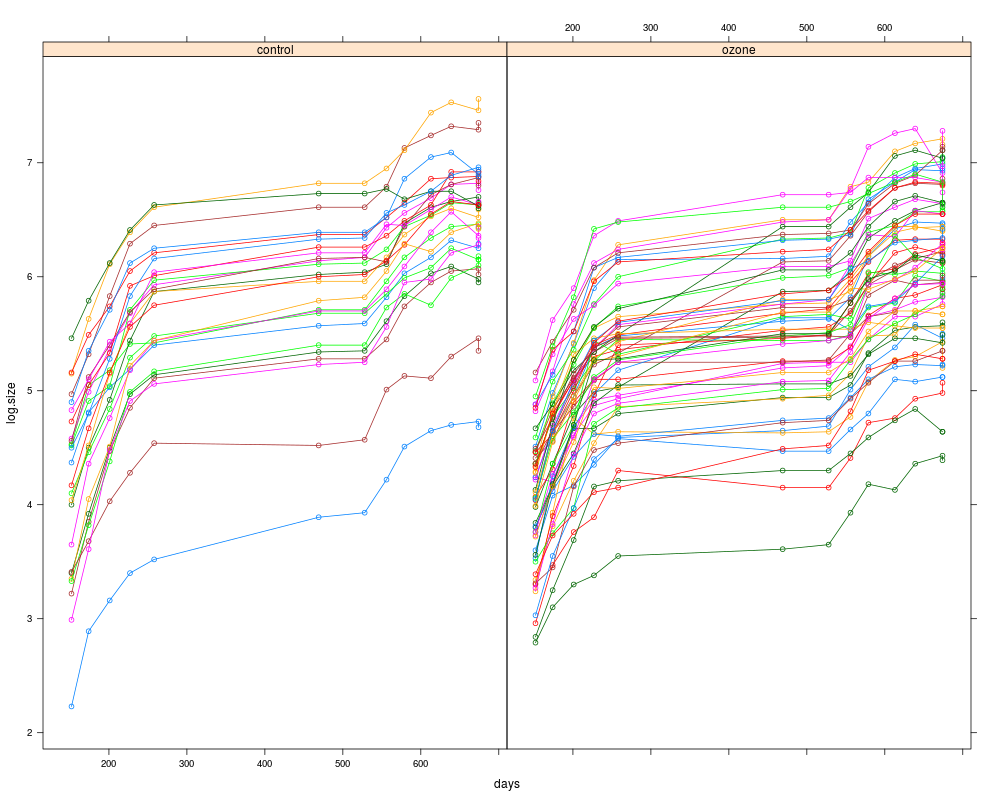
Sitka spruce dataDescriptionThe Usagedata(sitka) FormatThis data frame contains the following columns:
SourceDiggle, P.J., Heagerty, P., Liang, K.-Y. and Zeger, S.L. (2002). Analysis of Longitudinal Data, Second Edition, Oxord: Oxford University Press. ReferencesRuppert, D., Wand, M.P. and Carroll, R.J. (2003) Examples
library(SemiPar)
data(sitka)
attach(sitka)
library(lattice)
ozone.char <- rep("control",nrow(sitka))
ozone.char[ozone==1] <- "ozone"
xyplot(log.size~days|ozone.char,data=sitka,groups=id.num,type="b")
Results
R version 3.3.1 (2016-06-21) -- "Bug in Your Hair"
Copyright (C) 2016 The R Foundation for Statistical Computing
Platform: x86_64-pc-linux-gnu (64-bit)

R is free software and comes with ABSOLUTELY NO WARRANTY.
You are welcome to redistribute it under certain conditions.
Type 'license()' or 'licence()' for distribution details.

R is a collaborative project with many contributors.
Type 'contributors()' for more information and
'citation()' on how to cite R or R packages in publications.

Type 'demo()' for some demos, 'help()' for on-line help, or
'help.start()' for an HTML browser interface to help.
Type 'q()' to quit R.

> library(SemiPar)
> png(filename="/home/ddbj/snapshot/RGM3/R_CC/result/SemiPar/sitka.Rd_%03d_medium.png", width=480, height=480)
> ### Name: sitka
> ### Title: Sitka spruce data
> ### Aliases: sitka
> ### Keywords: datasets
>
> ### ** Examples
>
> library(SemiPar)
> data(sitka)
> attach(sitka)
> library(lattice)
> ozone.char <- rep("control",nrow(sitka))
> ozone.char[ozone==1] <- "ozone"
> xyplot(log.size~days|ozone.char,data=sitka,groups=id.num,type="b")
>
>
>
>
>
> dev.off()
null device
          1
>
|