Supported by Dr. Osamu Ogasawara and  . . |
|
Last data update: 2014.03.03 |
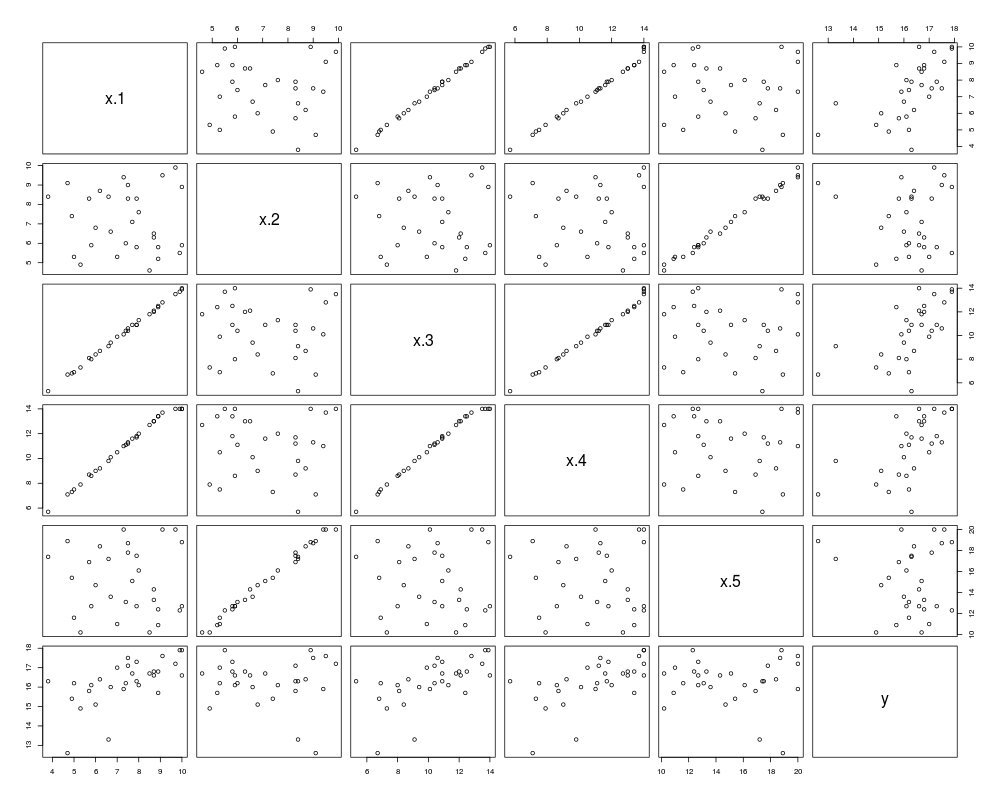
Supervisor Rating DataDescriptionThe Usagedata(E10.3) FormatThis data frame contains the following columns:
SourceSen and Srivastava (1990) Regression Analysis, Theory, Methods and Applications. Springer-verlag. Examplesdata(E10.3) summary(E10.3) plot(E10.3) Results
R version 3.3.1 (2016-06-21) -- "Bug in Your Hair"
Copyright (C) 2016 The R Foundation for Statistical Computing
Platform: x86_64-pc-linux-gnu (64-bit)

R is free software and comes with ABSOLUTELY NO WARRANTY.
You are welcome to redistribute it under certain conditions.
Type 'license()' or 'licence()' for distribution details.

R is a collaborative project with many contributors.
Type 'contributors()' for more information and
'citation()' on how to cite R or R packages in publications.

Type 'demo()' for some demos, 'help()' for on-line help, or
'help.start()' for an HTML browser interface to help.
Type 'q()' to quit R.

> library(SenSrivastava)
> png(filename="/home/ddbj/snapshot/RGM3/R_CC/result/SenSrivastava/E10.3.Rd_%03d_medium.png", width=480, height=480)
> ### Name: E10.3
> ### Title: Supervisor Rating Data
> ### Aliases: E10.3
> ### Keywords: datasets
>
> ### ** Examples
>
> data(E10.3)
> summary(E10.3)
      x.1              x.2             x.3              x.4
 Min.   : 3.800   Min.   :4.600   Min.   : 5.300   Min.   : 5.70
 1st Qu.: 6.050   1st Qu.:5.825   1st Qu.: 8.475   1st Qu.: 9.05
 Median : 7.500   Median :6.950   Median :10.500   Median :11.25
 Mean   : 7.377   Mean   :7.157   Mean   :10.293   Mean   :10.94
 3rd Qu.: 8.700   3rd Qu.:8.400   3rd Qu.:12.075   3rd Qu.:13.00
 Max.   :10.000   Max.   :9.900   Max.   :14.000   Max.   :14.00
      x.5              y
 Min.   :10.20   Min.   :12.60
 1st Qu.:12.70   1st Qu.:15.93
 Median :14.90   Median :16.35
 Mean   :15.13   Mean   :16.27
 3rd Qu.:17.73   3rd Qu.:16.95
 Max.   :20.00   Max.   :17.90
> plot(E10.3)
>
>
>
>
>
> dev.off()
null device
          1
>
|