Supported by Dr. Osamu Ogasawara and  . . |
|
Last data update: 2014.03.03 |
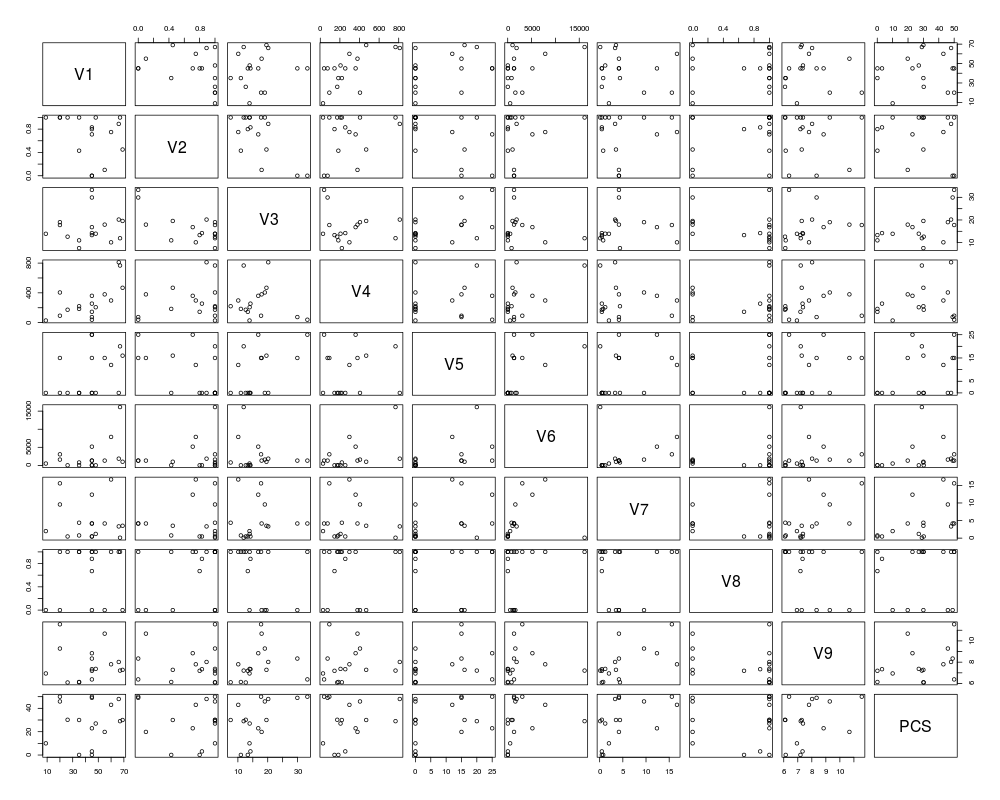
Data on Transit PrivatizationDescriptionThe Usagedata(E9.11) FormatThis data frame contains the following columns:
SourceProf E.K.Morlok, Dept. of Systems Engineering, University of Pennsylvania. Examplesdata(E9.11) summary(E9.11) plot(E9.11) Results
R version 3.3.1 (2016-06-21) -- "Bug in Your Hair"
Copyright (C) 2016 The R Foundation for Statistical Computing
Platform: x86_64-pc-linux-gnu (64-bit)

R is free software and comes with ABSOLUTELY NO WARRANTY.
You are welcome to redistribute it under certain conditions.
Type 'license()' or 'licence()' for distribution details.

R is a collaborative project with many contributors.
Type 'contributors()' for more information and
'citation()' on how to cite R or R packages in publications.

Type 'demo()' for some demos, 'help()' for on-line help, or
'help.start()' for an HTML browser interface to help.
Type 'q()' to quit R.

> library(SenSrivastava)
> png(filename="/home/ddbj/snapshot/RGM3/R_CC/result/SenSrivastava/E9.11.Rd_%03d_medium.png", width=480, height=480)
> ### Name: E9.11
> ### Title: Data on Transit Privatization
> ### Aliases: E9.11
> ### Keywords: datasets
>
> ### ** Examples
>
> data(E9.11)
> summary(E9.11)
       V1              V2               V3              V4
 Min.   : 9.00   Min.   :0.0000   Min.   : 7.57   Min.   : 27.93
 1st Qu.:35.00   1st Qu.:0.4500   1st Qu.:12.63   1st Qu.:145.00
 Median :45.00   Median :0.8300   Median :14.21   Median :220.00
 Mean   :43.24   Mean   :0.7035   Mean   :16.66   Mean   :288.59
 3rd Qu.:55.00   3rd Qu.:1.0000   3rd Qu.:19.03   3rd Qu.:379.45
 Max.   :69.00   Max.   :1.0000   Max.   :33.29   Max.   :810.98
       V5               V6                 V7               V8
 Min.   : 0.000   Min.   :   24.15   Min.   : 0.120   Min.   :0.0000
 1st Qu.: 0.000   1st Qu.:   38.99   1st Qu.: 0.760   1st Qu.:0.0000
 Median : 0.000   Median : 1327.02   Median : 3.520   Median :1.0000
 Mean   : 8.412   Mean   : 2480.35   Mean   : 4.905   Mean   :0.6794
 3rd Qu.:15.000   3rd Qu.: 1861.85   3rd Qu.: 4.380   3rd Qu.:1.0000
 Max.   :25.000   Max.   :16120.02   Max.   :16.680   Max.   :1.0000
       V9              PCS
 Min.   : 6.090   Min.   : 0.10
 1st Qu.: 6.940   1st Qu.:19.80
 Median : 7.340   Median :30.00
 Mean   : 7.798   Mean   :28.71
 3rd Qu.: 8.340   3rd Qu.:45.90
 Max.   :11.560   Max.   :50.00
> plot(E9.11)
>
>
>
>
>
> dev.off()
null device
          1
>
|