Supported by Dr. Osamu Ogasawara and  . . |
|
Last data update: 2014.03.03 |
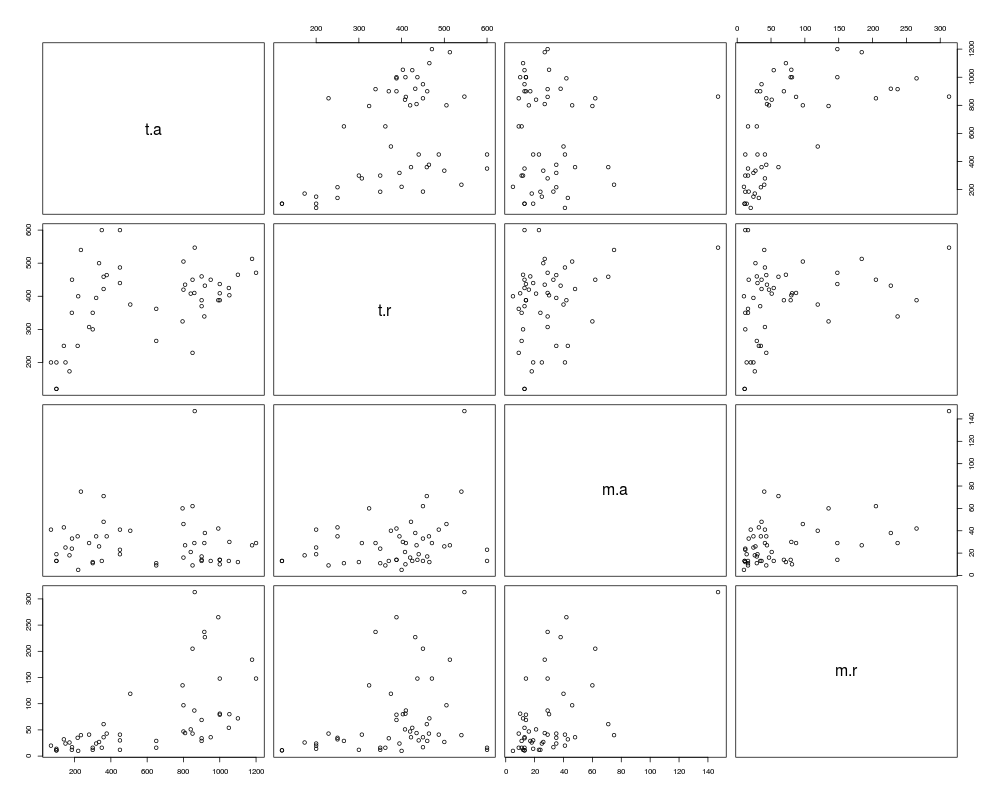
Data Travel Times and Usage for Automobiles and Public TransportationDescriptionThe Usagedata(E9.18) FormatThis data frame contains the following columns:
DetailsTravel times modified by one of the authors to reflect the cost of parking. For downtown zones (Chicago) this amounted to about 60 minutes. SourceSelected by Robert Drozd from Census (US) Urban Transportation Planning Package, for the Chicago area. Examplesdata(E9.18) summary(E9.18) plot(E9.18) Results
R version 3.3.1 (2016-06-21) -- "Bug in Your Hair"
Copyright (C) 2016 The R Foundation for Statistical Computing
Platform: x86_64-pc-linux-gnu (64-bit)

R is free software and comes with ABSOLUTELY NO WARRANTY.
You are welcome to redistribute it under certain conditions.
Type 'license()' or 'licence()' for distribution details.

R is a collaborative project with many contributors.
Type 'contributors()' for more information and
'citation()' on how to cite R or R packages in publications.

Type 'demo()' for some demos, 'help()' for on-line help, or
'help.start()' for an HTML browser interface to help.
Type 'q()' to quit R.

> library(SenSrivastava)
> png(filename="/home/ddbj/snapshot/RGM3/R_CC/result/SenSrivastava/E9.18.Rd_%03d_medium.png", width=480, height=480)
> ### Name: E9.18
> ### Title: Data Travel Times and Usage for Automobiles and Public
> ###   Transportation
> ### Aliases: E9.18
> ### Keywords: datasets
>
> ### ** Examples
>
> data(E9.18)
> summary(E9.18)
      t.a              t.r             m.a              m.r
 Min.   :  70.0   Min.   :120.0   Min.   :  5.00   Min.   : 10.00
 1st Qu.: 290.0   1st Qu.:331.5   1st Qu.: 13.00   1st Qu.: 24.00
 Median : 650.0   Median :408.0   Median : 25.00   Median : 41.00
 Mean   : 598.7   Mean   :385.2   Mean   : 29.39   Mean   : 69.41
 3rd Qu.: 900.0   3rd Qu.:454.5   3rd Qu.: 36.50   3rd Qu.: 80.50
 Max.   :1200.0   Max.   :600.0   Max.   :147.00   Max.   :313.00
> plot(E9.18)
>
>
>
>
>
> dev.off()
null device
          1
>
|
Created & Maintained by Osamu Ogasawara (osamu.ogasawara@gmail.com) and 