logical. Should multiple plots be plotted, that is barplots
for each effect in a separate plot
dprime
logical. Should multiattribute plot for product effects use average squared dprimes
instead of square root of F statistics
sep
logical. If TRUE then separate plot is plotted for each effect
(mult argument should be then also TRUE)
cex
The magnification to be used
interact.symbol
The symbol to be used for the interaction effects
isFixed
logical. Whether to plot tests of the fixed effects
isRand
logical. Whether to plot tests of the random effects
isScaling
logical. Whether to plot the scaling factor if present
...
other potential arguments.
Value
NULL is returned
Author(s)
Alexandra Kuznetsova
Examples
res <- sensmixed(c("Coloursaturation", "Colourbalance"),
Prod_effects=c("TVset"),
individual="Assessor", data=TVbo, MAM=TRUE,
reduce.random=FALSE)
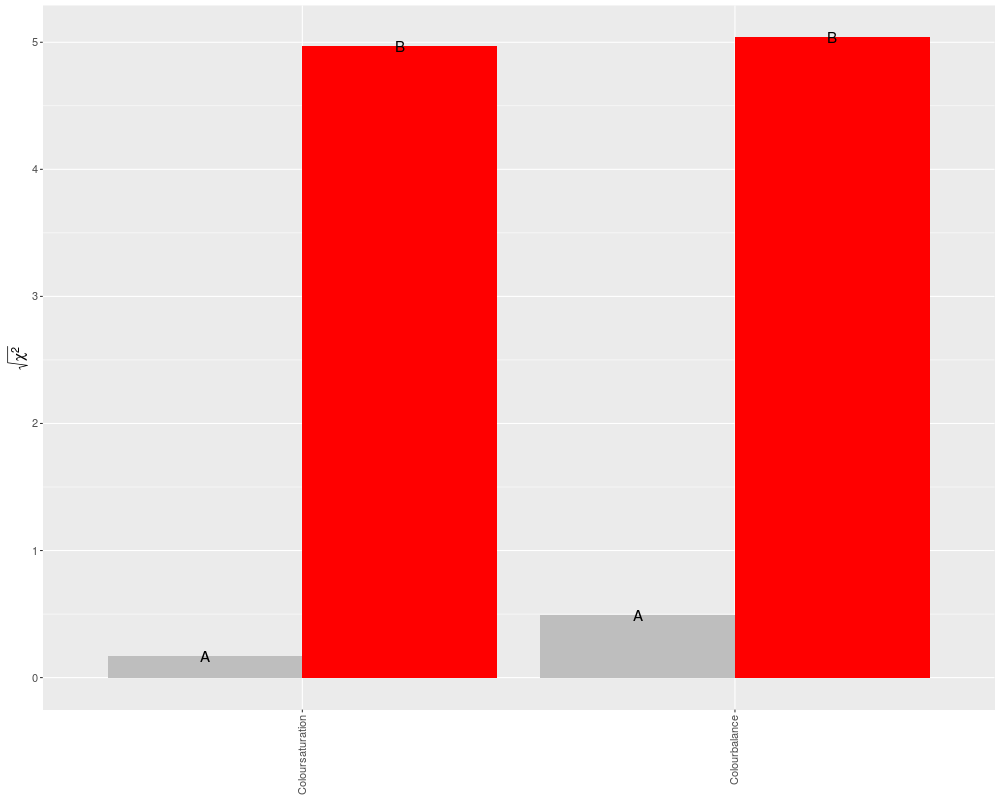
plot(res)
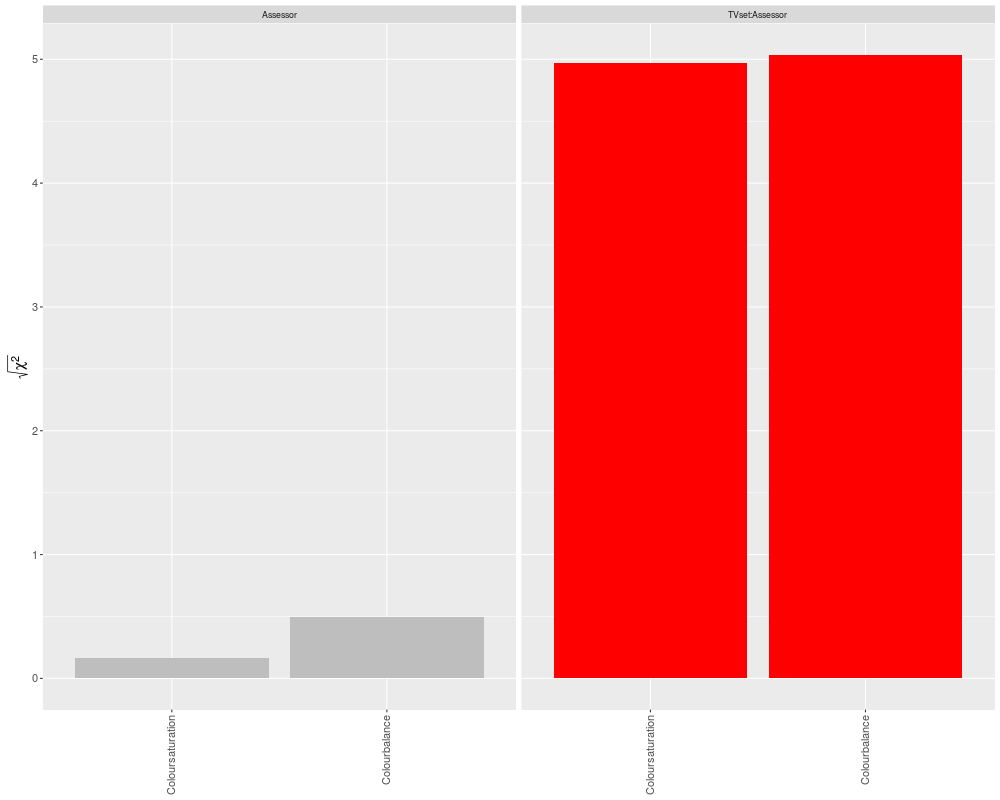
plot(res, mult = TRUE)
plot(res, interact.symbol = " x ")
Results
R version 3.3.1 (2016-06-21) -- "Bug in Your Hair"
Copyright (C) 2016 The R Foundation for Statistical Computing
Platform: x86_64-pc-linux-gnu (64-bit)

R is free software and comes with ABSOLUTELY NO WARRANTY.
You are welcome to redistribute it under certain conditions.
Type 'license()' or 'licence()' for distribution details.

R is a collaborative project with many contributors.
Type 'contributors()' for more information and
'citation()' on how to cite R or R packages in publications.

Type 'demo()' for some demos, 'help()' for on-line help, or
'help.start()' for an HTML browser interface to help.
Type 'q()' to quit R.

> library(SensMixed)
Loading required package: lmerTest
Loading required package: Matrix
Loading required package: lme4

Attaching package: 'lmerTest'

The following object is masked from 'package:lme4':

    lmer

The following object is masked from 'package:stats':

    step


Attaching package: 'SensMixed'

The following object is masked from 'package:lmerTest':

    ham

> png(filename="/home/ddbj/snapshot/RGM3/R_CC/result/SensMixed/plot.sensmixed.Rd_%03d_medium.png", width=480, height=480)
> ### Name: plot
> ### Title: function creates plots for the sensmixed object
> ### Aliases: plot.sensmixed
>
> ### ** Examples
>
> res <- sensmixed(c("Coloursaturation", "Colourbalance"),
+                   Prod_effects=c("TVset"),
+                   individual="Assessor", data=TVbo, MAM=TRUE,
+                   reduce.random=FALSE)
   |                                                                               |                                                                      |   0%fixed-effect model matrix is rank deficient so dropping 1 column / coefficient
   |                                                                               |===================================                                   |  50%fixed-effect model matrix is rank deficient so dropping 1 column / coefficient
   |                                                                               |======================================================================| 100%
> plot(res)
Using effs, effs_short, abbreffs as id variables
Using effs as id variables
> plot(res, mult = TRUE)
Using effs, effs_short, abbreffs as id variables
Using effs as id variables
> plot(res, interact.symbol = " x ")
Using effs, effs_short, abbreffs as id variables
Using effs as id variables
>
>
>
>
>
> dev.off()
null device
          1
>
 .
.