Supported by Dr. Osamu Ogasawara and  . . |
|
Last data update: 2014.03.03 |
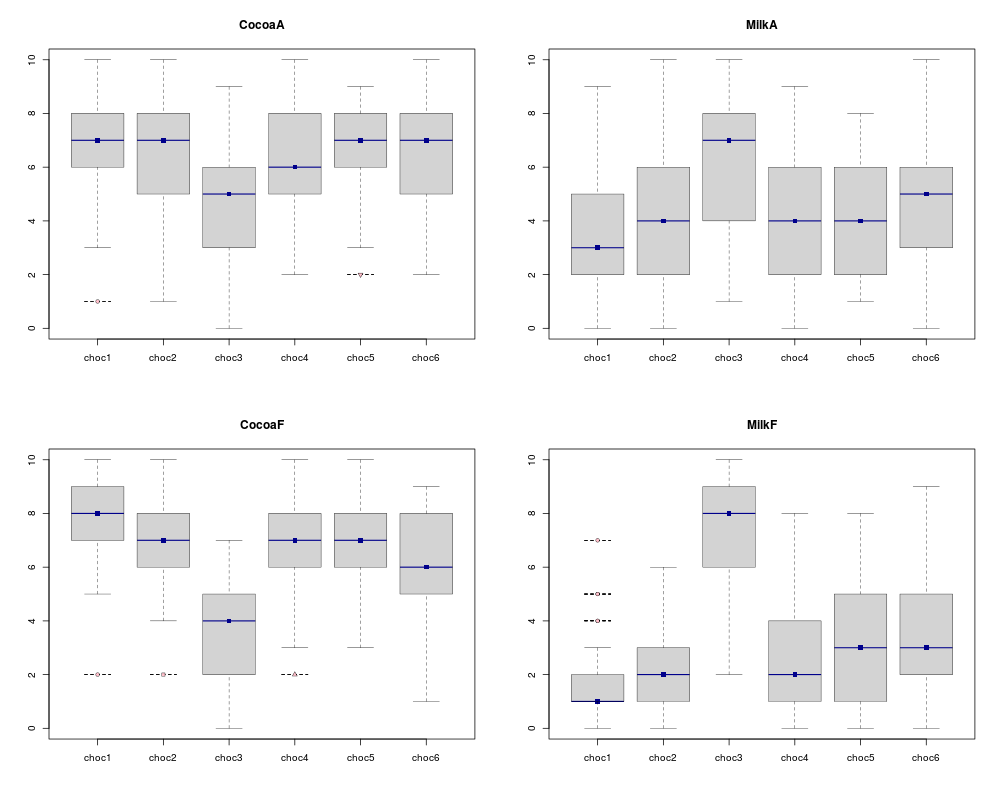
Boxplot per category with respect to a categorical variable and a set of quantitative variablesDescriptionReturns as many boxplots as there are categories for a given categorical variable of interest (in most cases, the product variable). The boxplots are automatically generated for all the quantitative variables (in our type of applications, variables are often sensory descriptors). Usage
boxprod(donnee, col.p, firstvar, lastvar = ncol(donnee),
    numr = 2, numc = 2)
Arguments
DetailsMissing values are ignored when forming boxplots. Author(s)F Husson husson@agrocampus-ouest.fr ReferencesBecker, R. A., Chambers, J. M. and Wilks, A. R. (1988) The New S Language. Wadsworth & Brooks/Cole. See Also
Examplesdata(chocolates) boxprod(sensochoc, col.p = 4, firstvar = 5, numr = 2, numc = 2) ResultsR version 3.3.1 (2016-06-21) -- "Bug in Your Hair" Copyright (C) 2016 The R Foundation for Statistical Computing Platform: x86_64-pc-linux-gnu (64-bit) R is free software and comes with ABSOLUTELY NO WARRANTY. You are welcome to redistribute it under certain conditions. Type 'license()' or 'licence()' for distribution details. R is a collaborative project with many contributors. Type 'contributors()' for more information and 'citation()' on how to cite R or R packages in publications. Type 'demo()' for some demos, 'help()' for on-line help, or 'help.start()' for an HTML browser interface to help. Type 'q()' to quit R. > library(SensoMineR) Loading required package: FactoMineR > png(filename="/home/ddbj/snapshot/RGM3/R_CC/result/SensoMineR/boxprod.Rd_%03d_medium.png", width=480, height=480) > ### Name: boxprod > ### Title: Boxplot per category with respect to a categorical variable and > ### a set of quantitative variables > ### Aliases: boxprod > ### Keywords: univar > > ### ** Examples > > data(chocolates) > boxprod(sensochoc, col.p = 4, firstvar = 5, numr = 2, numc = 2) Error in dev.new() : no suitable unused file name for pdf() Calls: boxprod -> dev.new Execution halted
|