Supported by Dr. Osamu Ogasawara and  . . |
|
Last data update: 2014.03.03 |
Coordinates of individuals and illustrative individuals for PCA or MFADescriptionThis function is especially designed to be used in a sensory data analysis context. Returns the coordinates of the products when performing either PCA or MFA and the coordinates of the "partial" products when performing MFA. Returns also the panelists' coordinates when projected as illustrative rows onto the products' space. Produces graphs of products and descriptors from the output of PCA or MFA. Usage
construct.axes(matrice, coord = c(1,2), scale.unit = TRUE, group = NULL,
      name.group = NULL, centerbypanelist = FALSE, scalebypanelist = FALSE,
      method = "coeff")
Arguments
DetailsThe input data set is an object of class The ouptut of this function is a list with one element when performing PCA and two elements
when performing MFA. The first element is the data frame of the coordinates of the products according to
the whole panel (Panelist=0) and to the panelists.
The second element is the data frame of the coordinates of the "partial products"
according to the whole panel (Panelist=0) and to the panelists. This function is necessary when calculating confidence ellipses for products. ValueA list containing the following elements:
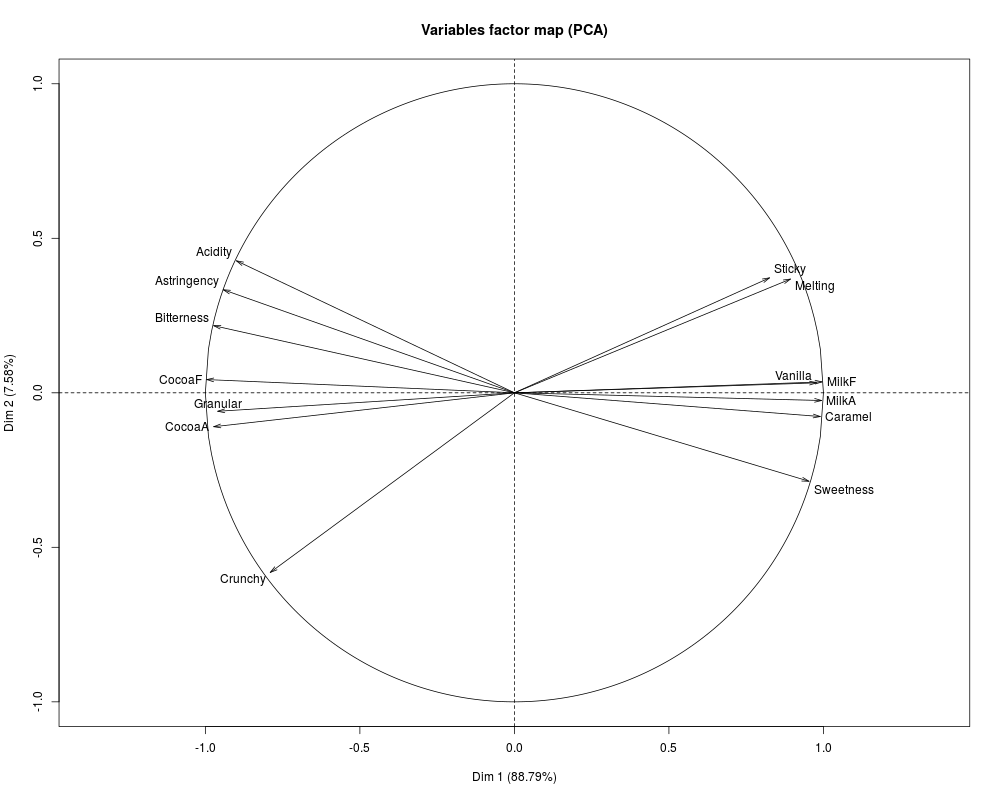
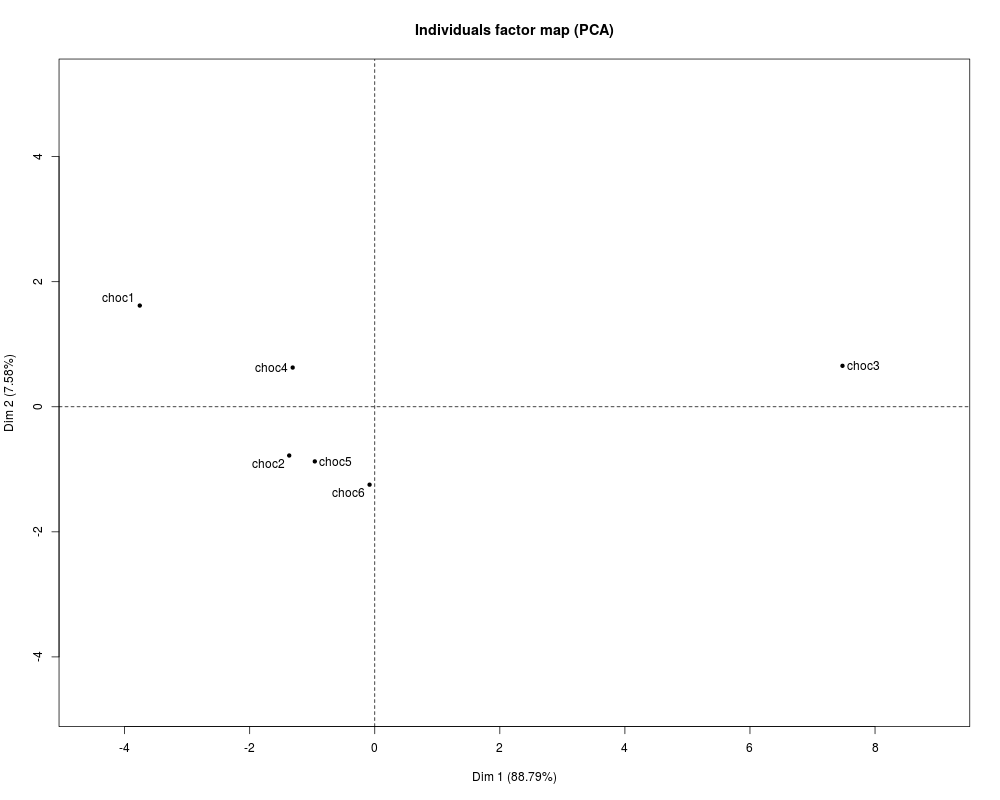
Returns also a correlation circle as well as a graph of individuals Author(s)Francois Husson ReferencesEscofier, B. and Pages, J. (1990)
Analyses factorielles simples et multiples: objectifs, methodes et interpretation
Dunod, Paris. 1–267. Escofier, B. and Pages, J. (1994) Multiple factor analysis (AFMULT package). Computational Statistics and Data Analysis, 18, 121–140. See Also
Examples
## Example1: PCA
data(chocolates)
donnee <- cbind.data.frame(sensochoc[,c(1,4,5:18)])
axe <- construct.axes(donnee, scale.unit = TRUE)

## Example2: MFA (two groups of variables)
data(chocolates)
donnee <- cbind.data.frame(sensochoc[,c(1,4,5:18)])
axe <- construct.axes(donnee, group = c(6,8),
    name.group = c("A-F","T-S"),scale.unit = TRUE)
ResultsR version 3.3.1 (2016-06-21) -- "Bug in Your Hair" Copyright (C) 2016 The R Foundation for Statistical Computing Platform: x86_64-pc-linux-gnu (64-bit) R is free software and comes with ABSOLUTELY NO WARRANTY. You are welcome to redistribute it under certain conditions. Type 'license()' or 'licence()' for distribution details. R is a collaborative project with many contributors. Type 'contributors()' for more information and 'citation()' on how to cite R or R packages in publications. Type 'demo()' for some demos, 'help()' for on-line help, or 'help.start()' for an HTML browser interface to help. Type 'q()' to quit R. > library(SensoMineR) Loading required package: FactoMineR > png(filename="/home/ddbj/snapshot/RGM3/R_CC/result/SensoMineR/construct.axes.Rd_%03d_medium.png", width=480, height=480) > ### Name: construct.axes > ### Title: Coordinates of individuals and illustrative individuals for PCA > ### or MFA > ### Aliases: construct.axes > ### Keywords: multivariate > > ### ** Examples > > ## Example1: PCA > data(chocolates) > donnee <- cbind.data.frame(sensochoc[,c(1,4,5:18)]) > axe <- construct.axes(donnee, scale.unit = TRUE) Error in dev.new() : no suitable unused file name for pdf() Calls: construct.axes -> dev.new Execution halted
|