Supported by Dr. Osamu Ogasawara and  . . |
|
Last data update: 2014.03.03 |
DEscription of CATegoriesDescriptionThis function is designed to point out the variables that are the most characteristic according
to the set of products in its whole, and to each of the products in particular. This function is designed to test the main effect of a categorical variable (F-test) and the significance of its coefficients (T-test) for a set of endogenous variables and a given analysis of variance model. In most cases, the main effect is the product effect and the endogenous variables are the sensory descriptors. Usage
decat(donnee, formul, firstvar, lastvar = length(colnames(donnee)),
    proba = 0.05, graph = TRUE, col.lower = "mistyrose",
    col.upper = "lightblue", nbrow = NULL, nbcol = NULL, random = TRUE)
Arguments
DetailsThe ValueA list containing the following elements:
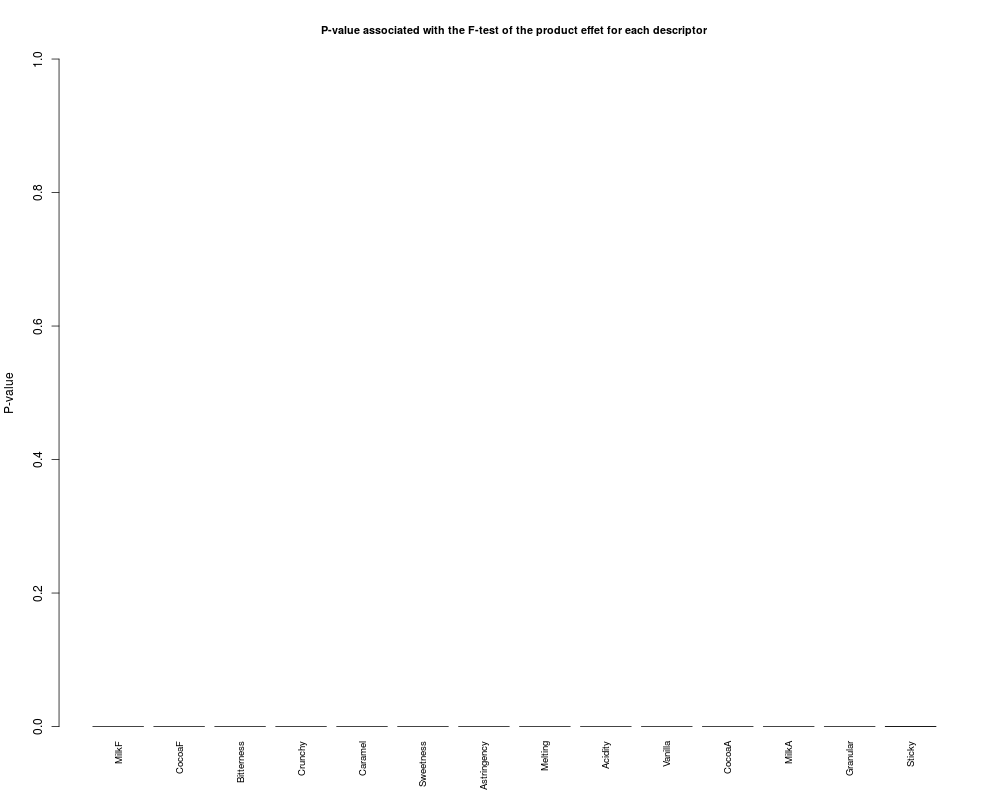
A barplot of the P-values associated with the F-test of the product effet. Author(s)Francois Husson ReferencesP. Lea, T. Naes, M. Rodbotten. Analysis of variance for sensory data. See Also
Examples
### Example 1
data(chocolates)
## model (AOV): " descriptor = product + panelist "
resdecat<-decat(sensochoc, formul="~Product+Panelist", firstvar = 5)
barrow(resdecat$tabT)
barrow(t(resdecat$tabT), numr = 3, numc = 3)
barrow(resdecat$coeff, color = "orange")

### Example 2
data(chocolates)
## model (AOV): " descriptor = product + panelist "
res2 <-decat(sensochoc, formul="~Product+Panelist", firstvar = 5,
    proba=1, graph = FALSE)
ResultsR version 3.3.1 (2016-06-21) -- "Bug in Your Hair" Copyright (C) 2016 The R Foundation for Statistical Computing Platform: x86_64-pc-linux-gnu (64-bit) R is free software and comes with ABSOLUTELY NO WARRANTY. You are welcome to redistribute it under certain conditions. Type 'license()' or 'licence()' for distribution details. R is a collaborative project with many contributors. Type 'contributors()' for more information and 'citation()' on how to cite R or R packages in publications. Type 'demo()' for some demos, 'help()' for on-line help, or 'help.start()' for an HTML browser interface to help. Type 'q()' to quit R. > library(SensoMineR) Loading required package: FactoMineR > png(filename="/home/ddbj/snapshot/RGM3/R_CC/result/SensoMineR/decat.Rd_%03d_medium.png", width=480, height=480) > ### Name: decat > ### Title: DEscription of CATegories > ### Aliases: decat > ### Keywords: models > > ### ** Examples > > ### Example 1 > data(chocolates) > ## model (AOV): " descriptor = product + panelist " > resdecat<-decat(sensochoc, formul="~Product+Panelist", firstvar = 5) Error in dev.new() : no suitable unused file name for pdf() Calls: decat -> coltable -> police -> dev.new Execution halted
|