Supported by Dr. Osamu Ogasawara and  . . |
|
Last data update: 2014.03.03 |
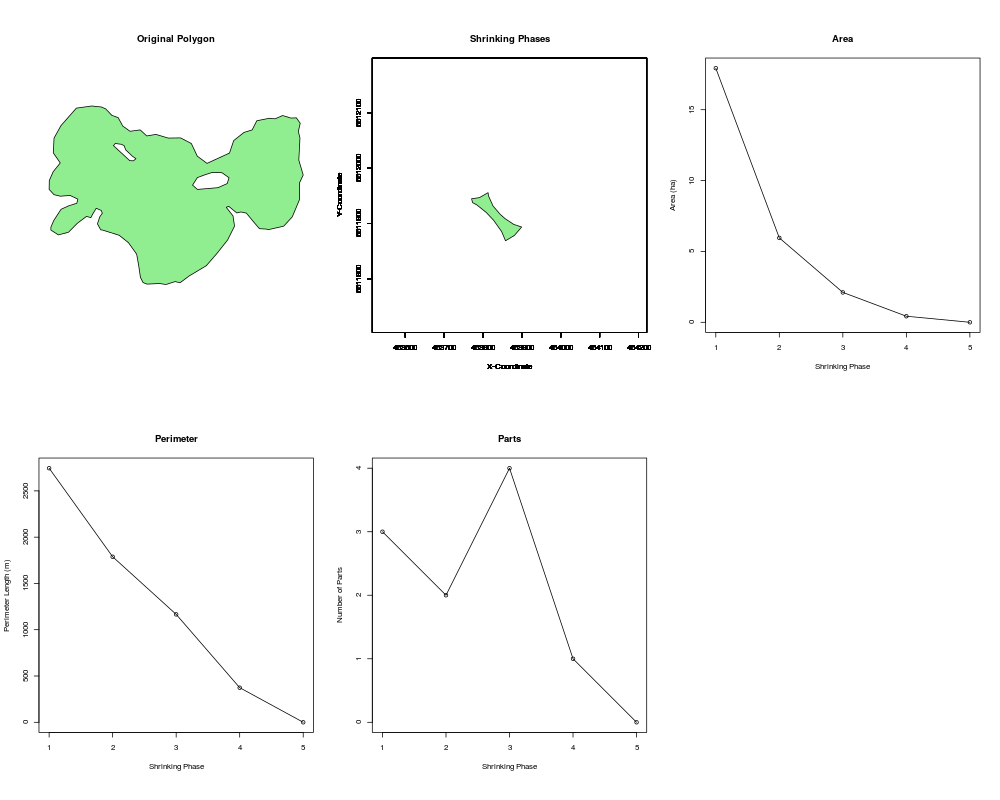
Decompose a planar shape (polygon) to produce area, perimeter, and number of parts spectraDescriptionGiven a single- or multi-part polygon (imported from a shapefile), ssr decomposes the shape by iteratively shrinking it by a specified distance until it becomes extinct. At each iteration of shrinking, the area, perimeter, and number of parts forming the resultant polygon are stored. Graphic plots and maps along with a tabular result are returned. This version works fully within R and no longer requires RSAGA GIS installed, making it more streamlined and faster. Usage
ssr(DIST = 25, shp = data$p4no, colours = c("LightGreen", "Tan"), PLOT = TRUE)
Arguments
ValueIf PLOT = TRUE, the function returns to the display maps of the decomposed polygon shape along with plots of the area, perimeter, and number of parts spectra. The function by default returns the tabular data from which the spectra can be plotted at any time. NoteThe shapefile must already be imported (e.g. with readOGR) and have only one unique shape (although it may be multi-part and contain holes). The projection must be rectangular with units in meters (not decimal degrees or other angular unit) Author(s)Tarmo K. Remmel ReferencesRemmel, T.K. 2015. ShrinkShape2: a FOSS toolbox for computing rotation-invariant shape spectra for characterizing and comparing polygons. The Canadian Geographer 59(4):532-547. See AlsoSee Also Examples
data$out <- ssr(DIST=25, shp=data$p4is, PLOT=TRUE, colours=c("LightGreen", "Tan"))
print(data$out)
Results
R version 3.3.1 (2016-06-21) -- "Bug in Your Hair"
Copyright (C) 2016 The R Foundation for Statistical Computing
Platform: x86_64-pc-linux-gnu (64-bit)

R is free software and comes with ABSOLUTELY NO WARRANTY.
You are welcome to redistribute it under certain conditions.
Type 'license()' or 'licence()' for distribution details.

R is a collaborative project with many contributors.
Type 'contributors()' for more information and
'citation()' on how to cite R or R packages in publications.

Type 'demo()' for some demos, 'help()' for on-line help, or
'help.start()' for an HTML browser interface to help.
Type 'q()' to quit R.

> library(ShapePattern)
Loading required package: rgdal
Loading required package: sp
rgdal: version: 1.1-10, (SVN revision 622)
 Geospatial Data Abstraction Library extensions to R successfully loaded
 Loaded GDAL runtime: GDAL 1.11.3, released 2015/09/16
 Path to GDAL shared files: /usr/share/gdal/1.11
 Loaded PROJ.4 runtime: Rel. 4.9.2, 08 September 2015, [PJ_VERSION: 492]
 Path to PROJ.4 shared files: (autodetected)
 Linking to sp version: 1.2-3
Loading required package: rgeos
rgeos version: 0.3-19, (SVN revision 524)
 GEOS runtime version: 3.5.0-CAPI-1.9.0 r4084
 Linking to sp version: 1.2-3
 Polygon checking: TRUE

> png(filename="/home/ddbj/snapshot/RGM3/R_CC/result/ShapePattern/ssr.Rd_%03d_medium.png", width=480, height=480)
> ### Name: ssr
> ### Title: Decompose a planar shape (polygon) to produce area, perimeter,
> ###   and number of parts spectra
> ### Aliases: ssr
> ### Keywords: manip
>
> ### ** Examples
>
> data$out <- ssr(DIST=25, shp=data$p4is, PLOT=TRUE, colours=c("LightGreen", "Tan"))
2.3.4.5.6.7.8.9.10.11.12.13.14.15.16.17.18.19.20.21.22.23.24.25.26.27.28.> print(data$out)
  CumShrink Phase       Area Perimeter NumParts
1         0     1 179262.969 2744.8435        3
2        25     2  59531.031 1788.3186        2
3        50     3  21068.830 1165.7890        4
4        75     4   4267.741  373.8764        1
5       100     5      0.000    0.0000        0
>
>
>
>
>
> dev.off()
null device
          1
>
|