Supported by Dr. Osamu Ogasawara and  . . |
|
Last data update: 2014.03.03 |
test for optimal Sharpe ratioDescriptionPerforms one sample tests of Sharpe ratio of the Markowitz portfolio. Usage
sropt_test(X,alternative=c("greater","two.sided","less"),
            zeta.s=0,ope=1,conf.level=0.95)
Arguments
DetailsSuppose xi are n independent draws of a q-variate normal random variable with mean mu and covariance matrix Sigma. This code tests the hypothesis H0: mu' Sigma^-1 mu = delta_0^2 The default alternative hypothesis is the one-sided H1: mu' Sigma^-1 mu > delta_0^2 but this can be set otherwise. Note there is no 'drag' term here since this represents a linear offset of the population parameter. ValueA list with class
Author(s)Steven E. Pav shabbychef@gmail.com See Also
Other sropt: Examples
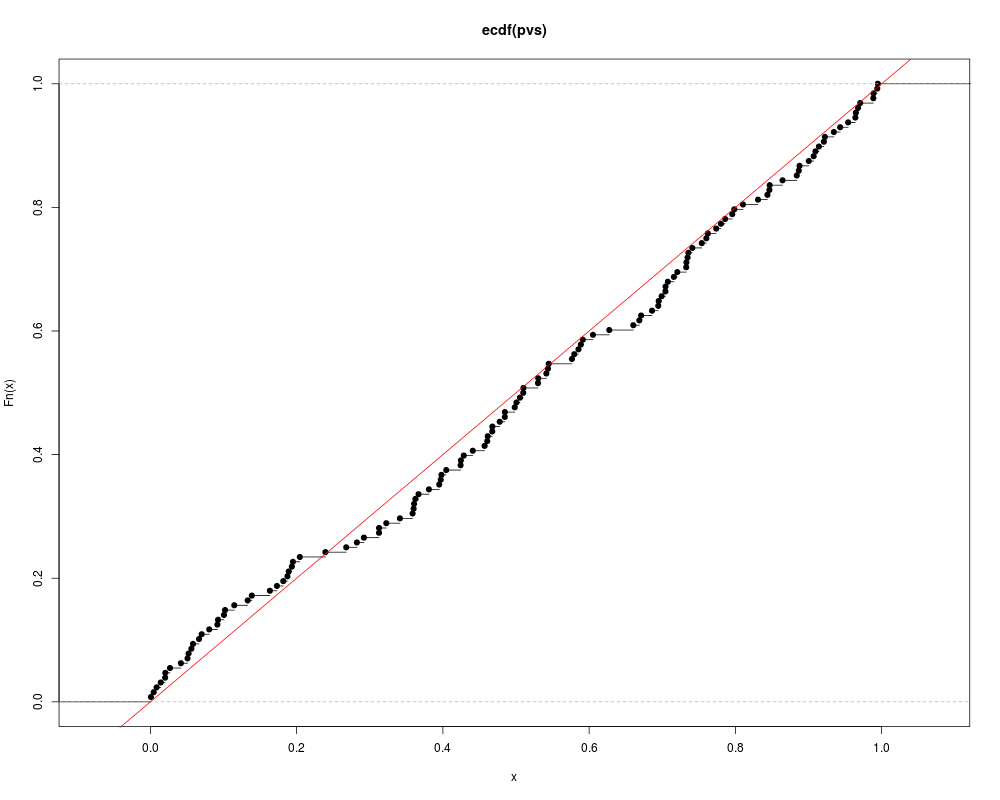
# test for uniformity
pvs <- replicate(128,{ x <- sropt_test(matrix(rnorm(1000*4),ncol=4),alternative="two.sided")
                        x$p.value })
plot(ecdf(pvs))
abline(0,1,col='red')

# input a sropt objects:
nfac <- 5
nyr <- 10
ope <- 253
# simulations with no covariance structure.
# under the null:
set.seed(as.integer(charToRaw("be determinstic")))
Returns <- matrix(rnorm(ope*nyr*nfac,mean=0,sd=0.0125),ncol=nfac)
asro <- as.sropt(Returns,drag=0,ope=ope)
stest <- sropt_test(asro,alternative="two.sided")
Results
R version 3.3.1 (2016-06-21) -- "Bug in Your Hair"
Copyright (C) 2016 The R Foundation for Statistical Computing
Platform: x86_64-pc-linux-gnu (64-bit)

R is free software and comes with ABSOLUTELY NO WARRANTY.
You are welcome to redistribute it under certain conditions.
Type 'license()' or 'licence()' for distribution details.

R is a collaborative project with many contributors.
Type 'contributors()' for more information and
'citation()' on how to cite R or R packages in publications.

Type 'demo()' for some demos, 'help()' for on-line help, or
'help.start()' for an HTML browser interface to help.
Type 'q()' to quit R.

> library(SharpeR)

Attaching package: 'SharpeR'

The following object is masked from 'package:base':

    summary

> png(filename="/home/ddbj/snapshot/RGM3/R_CC/result/SharpeR/sropt_test.Rd_%03d_medium.png", width=480, height=480)
> ### Name: sropt_test
> ### Title: test for optimal Sharpe ratio
> ### Aliases: sropt_test
> ### Keywords: htest
>
> ### ** Examples
>
>
> # test for uniformity
> pvs <- replicate(128,{ x <- sropt_test(matrix(rnorm(1000*4),ncol=4),alternative="two.sided")
+                         x$p.value })
> plot(ecdf(pvs))
> abline(0,1,col='red')
>
> # input a sropt objects:
> nfac <- 5
> nyr <- 10
> ope <- 253
> # simulations with no covariance structure.
> # under the null:
> set.seed(as.integer(charToRaw("be determinstic")))
> Returns <- matrix(rnorm(ope*nyr*nfac,mean=0,sd=0.0125),ncol=nfac)
> asro <- as.sropt(Returns,drag=0,ope=ope)
> stest <- sropt_test(asro,alternative="two.sided")
>
>
>
>
>
>
> dev.off()
null device
          1
>
|