Supported by Dr. Osamu Ogasawara and  . . |
|
Last data update: 2014.03.03 |
Class
|
files |
A character() or |
range |
A |
... |
Additional, optional, arguments to be passed to the
Snapshot
|
Methods
- zoom
signature(x = "Snapshot"): Zoom (in or out) the current plot.- pan
signature(x = "Snapshot"): Pan (right or left) the current plot.- togglefun
signature(x = "Snapshot"): Toggle the current functions which imported records are to be immediately evaluated. Note that the active range will be changed to the current active window.- togglep
signature(x = "Snapshot"): Toggle the panning effects.- togglez
signature(x = "Snapshot"): Toggle the zooming effects.
Accessors
- show
signature(object = "Snapshot"): Display aSnapshotobject.- files
signature(x = "Snapshot"): Get thefilesfield (object of classBamFileList) of aSnapshotobject.- functions
signature(x = "Snapshot"): Get thefunctionsfield (object ofSnapshotFunctionList) of aSnapshotobject.- view
signature(x = "Snapshot"): Get theviewfield (object ofSpTrellis) of aSnapshotobject.- vrange
signature(x = "Snapshot"): Get the.rangefield (object ofGRanges) of aSnapshotobject.- getTrellis
signature(x = "Snapshot"): Get thetrellisobject, a field of theSpTrellisobject.
Fields
.debug:Object of class
functionto display messages while in debug mode.auto_display:Object of class
logicalto automatically display the coverage plot..range:Object of class
GRangesindicating which ranges of records to be imported from BAM fields..zin:Object of class
logicalindicating whether the current zooming effect is zoom in..pright:Object of class
logicalindicating whether the current panning effect is right..data:Object of class
data.framecontaining coverage a position is represented for each strand and BAM file..data_dirty:Object of class
logicalindicating whether to re-evaluate the imported records..initial_functions:Object of class
SnapshotFunctionListavailable by theSnapshotobject..current_function:Object of class
characterof the function the imported recorded are currently evaluated and visualized.annTrack:Default to
NULLif not intended to visualize the annotation track. If default visualization function(s) is intended to be used to plot the annotation,annTrackhas to be aGRangesinstance.functions:Object of class
SnapshotFunctionListof customized functions to evaluate and visualize the imported records.files:Object of class
BamFileListto be imported.view:Object of class
SpTrellisthat is essentially a reference class wrapper ofTrellisobjects.
Class-Based Methods
display():Display the current
Snapshotobject.pan():Pan (right or left) the current plot.
zoom():Zoom (in or out) the current plot.
toggle(zoom, pan, currentFunction):Toggle zooming, panning effects or the currentFuction in which the imported records are to be evaluated and visualized.
Author(s)
Martin Morgan and Chao-Jen Wong cwon2@fhcrc.org
See Also
SpTrellis
Examples
## example 1: Importing specific ranges of records
file <- system.file("extdata", "SRR002051.chrI-V.bam",
package="yeastNagalakshmi")
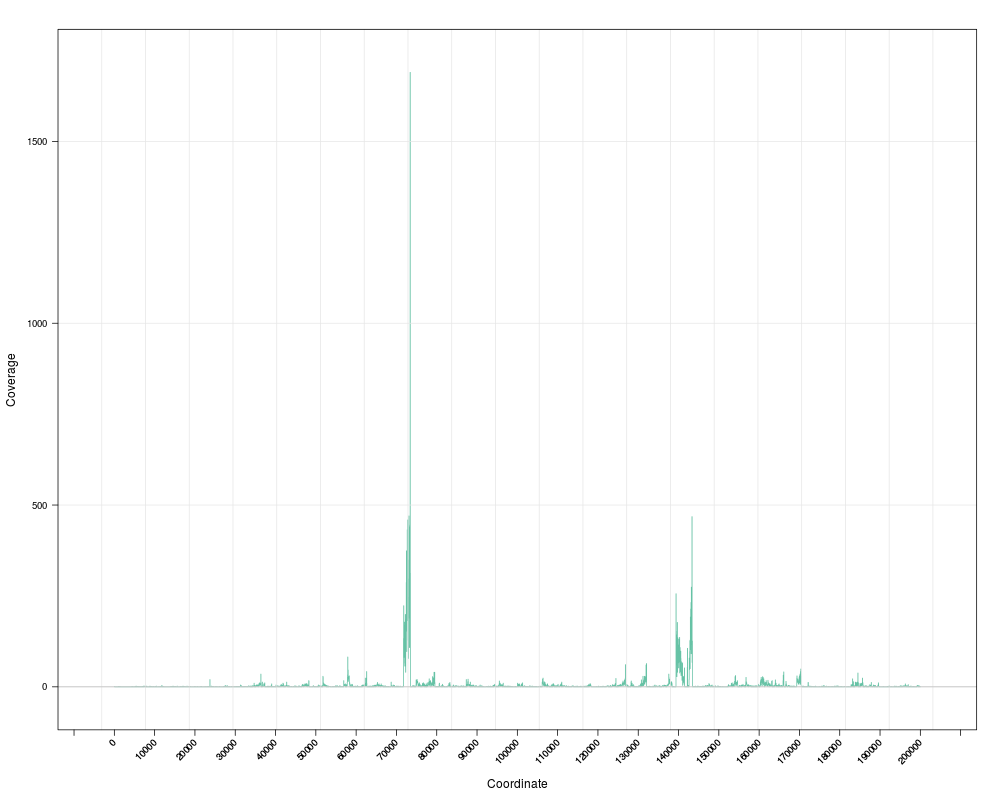
which <- GRanges("chrI", IRanges(1, 2e5))
s <- Snapshot(file, range=which)
## methods
zoom(s) # zoom in
## zoom in to a specific region
zoom(s, range=GRanges("chrI", IRanges(7e4, 7e4+8000)))
pan(s) # pan right
togglez(s) # change effect of zooming
zoom(s) # zoom out
togglep(s) # change effect of panning
pan(s)
## accessors
functions(s)
vrange(s)
show(s)
ignore.strand(s)
view(s) ## extract the spTrellis object
getTrellis(s) ## extract the trellis object
## example 2: ignore strand
s <- Snapshot(file, range=which, ignore.strand=TRUE)
##
## example 3: visualizing annotation track
##
library(GenomicFeatures)
getAnnGR <- function(txdb, which) {
ex <- exonsBy(txdb, by="gene")
seqlevels(ex, force=TRUE) <- seqlevels(which)
r <- range(ex)
gr <- unlist(r)
values(gr)[["gene_id"]] <- rep.int(names(r), times=lengths(r))
gr
}
txdbFile <- system.file("extdata", "sacCer2_sgdGene.sqlite",
package="yeastNagalakshmi")
# txdb <- makeTxDbFromUCSC(genome="sacCer2", tablename="sgdGene")
txdb <- loadDb(txdbFile)
which <- GRanges("chrI", IRanges(1, 2e5))
gr <- getAnnGR(txdb, which)
## note that the first column of the elementMetadata annotates of the
## range of the elements.
gr
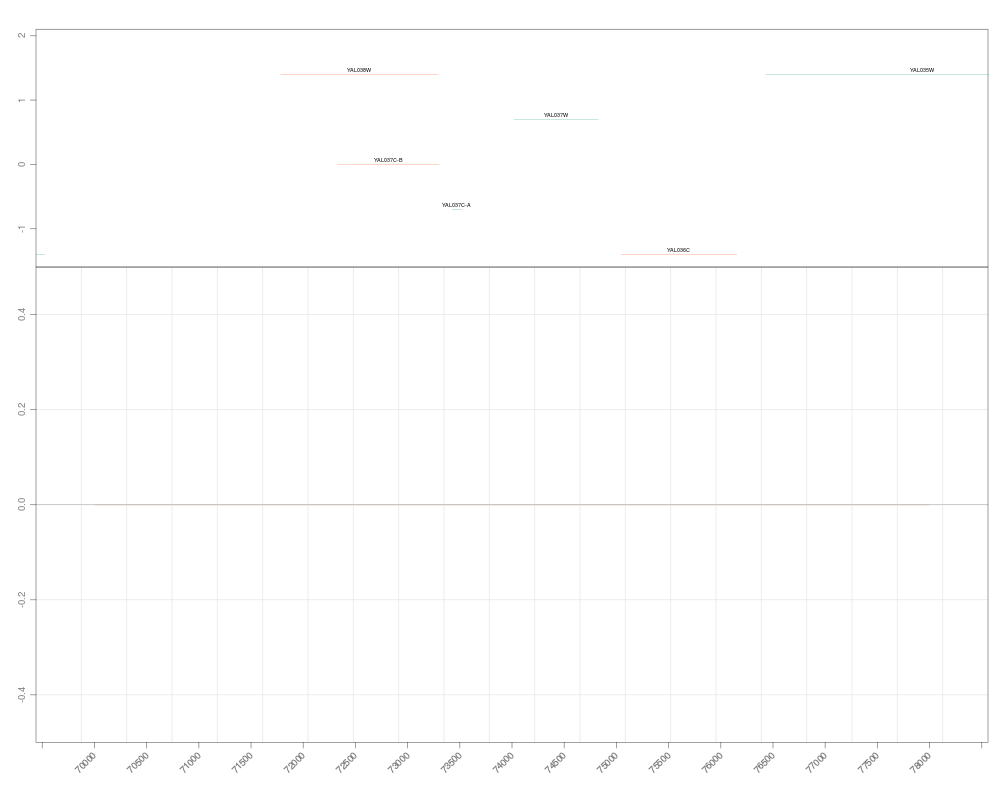
s <- Snapshot(file, range=which, annTrack=gr)
annTrack(s)
## zoom in to an interesting region
zoom(s, range=GRanges("chrI", IRanges(7e4, 7e4+8000)))
togglez(s) ## zoom out
zoom(s)
pan(s)
## example 4, 5, 6: multiple BAM files with 'multicoarse_covarage'
## and 'multifine_coverage' view.
## Resolution does not automatically switch for views of multiple
## files. It is important to note if width(which) < 10,000, use
## multifine_coverage. Otherwise use multicoarse_coverage
file <- system.file("extdata", "SRR002051.chrI-V.bam",
package="yeastNagalakshmi")
which <- GRanges("chrI", IRanges(1, 2e5))
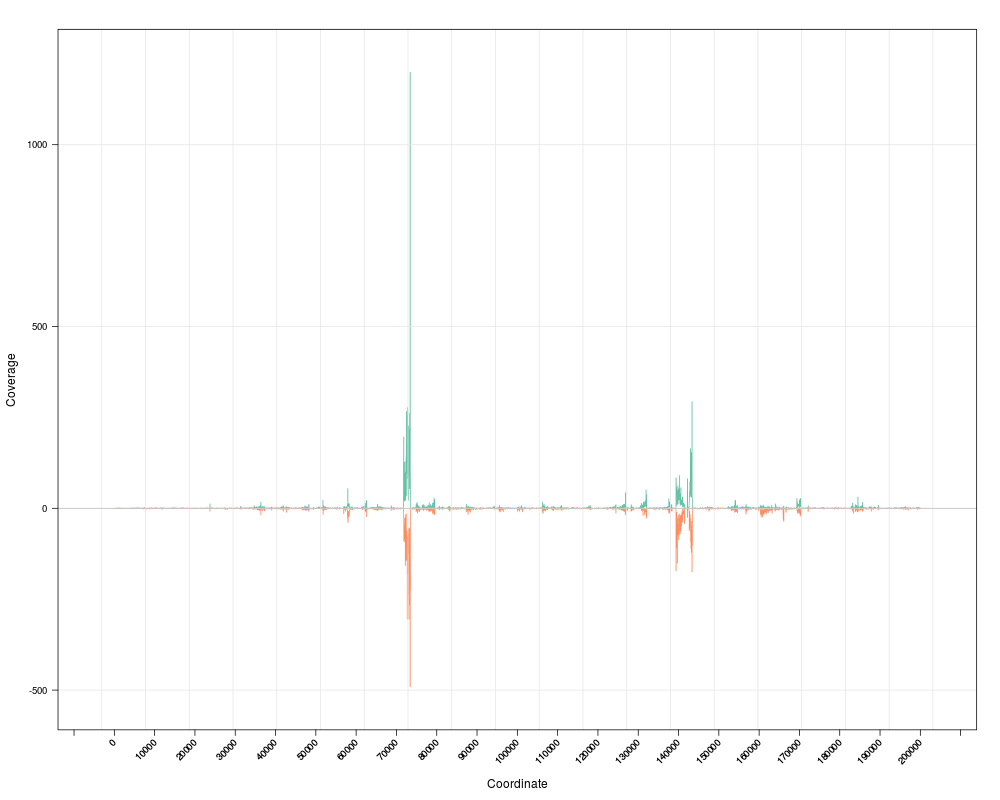
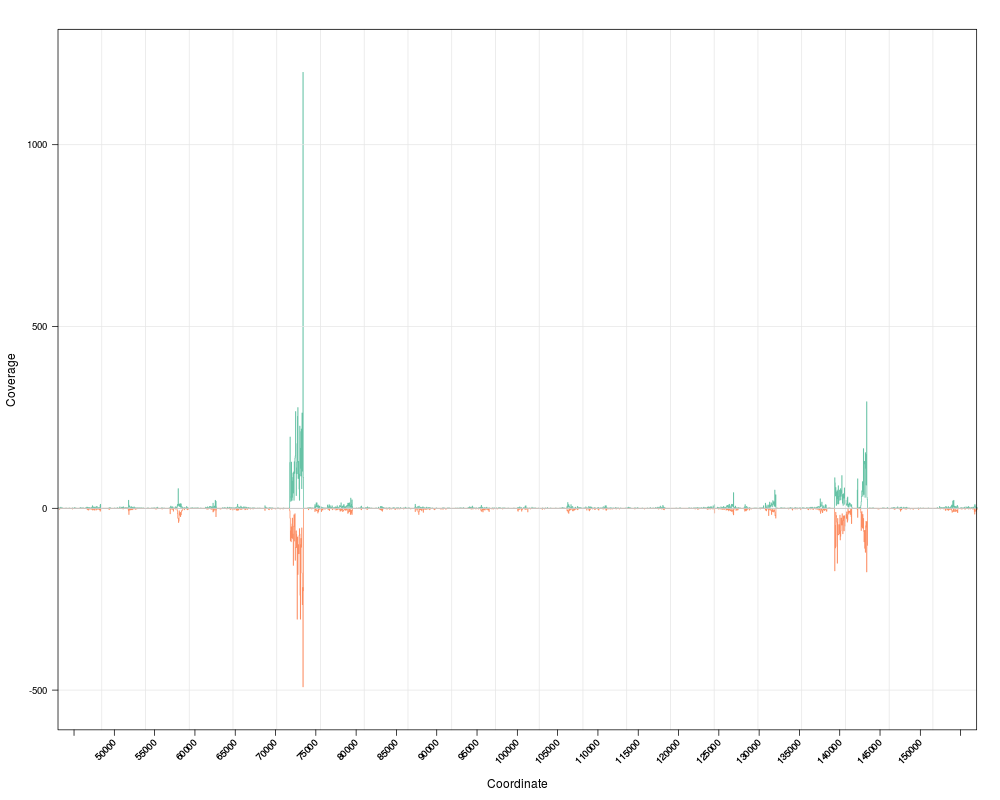
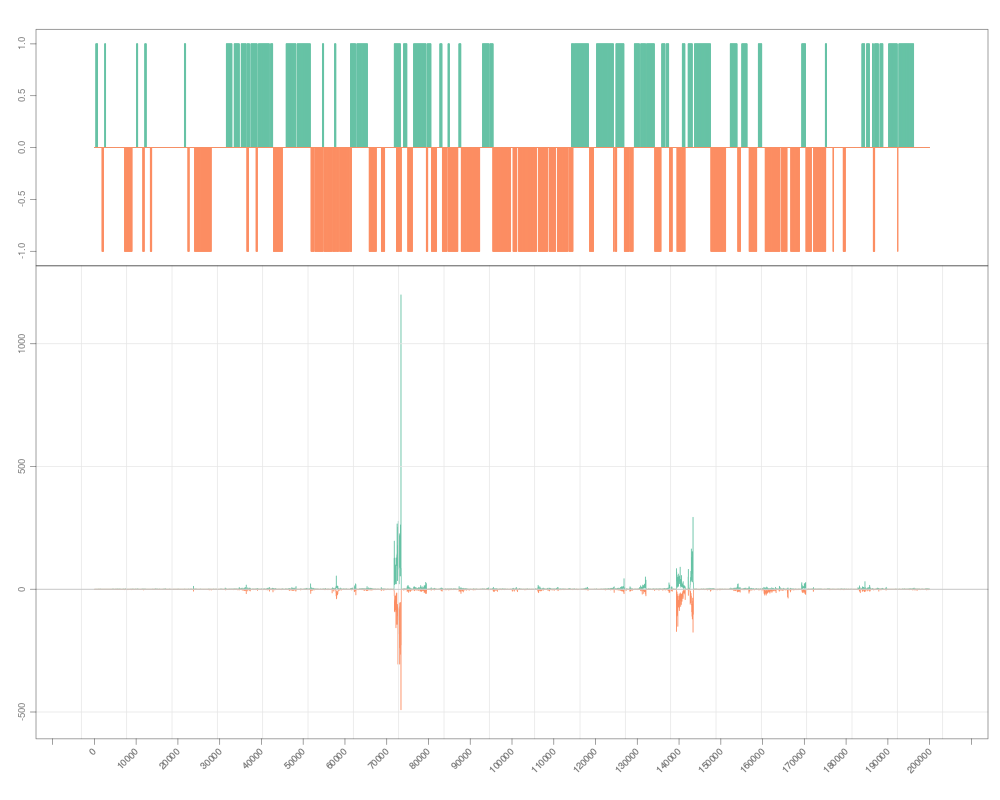
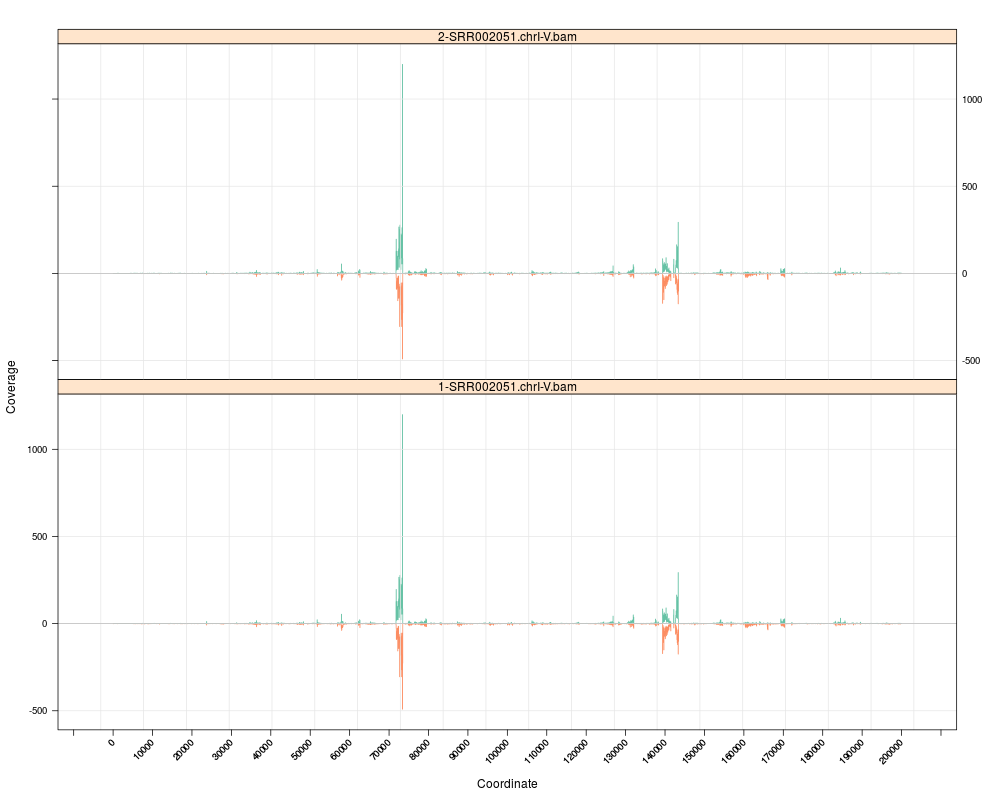
s <- Snapshot(c(file, file), range=which,
currentFunction="multicoarse_coverage")
## grouping files and view by 'multicoarse_coverage'
bfiles <- BamFileList(c(a=file, b=file))
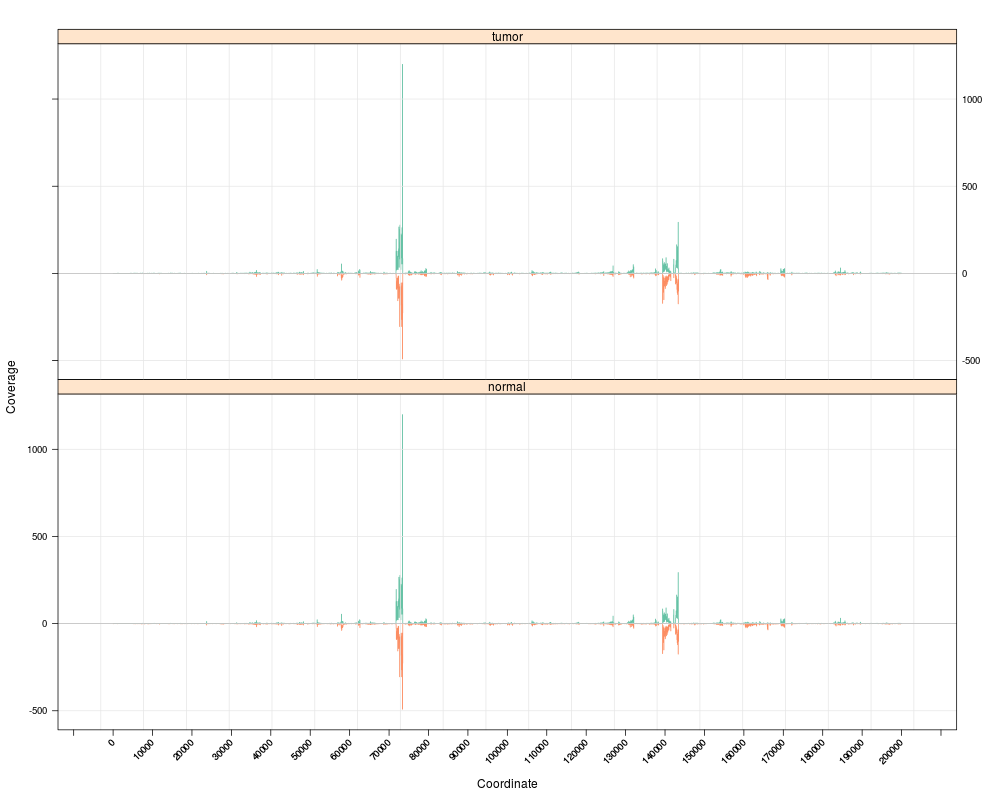
values(bfiles) <- DataFrame(sampleGroup=factor(c("normal", "tumor")))
values(bfiles)
s <- Snapshot(bfiles, range=which,
currentFunction="multicoarse_coverage", fac="sampleGroup")
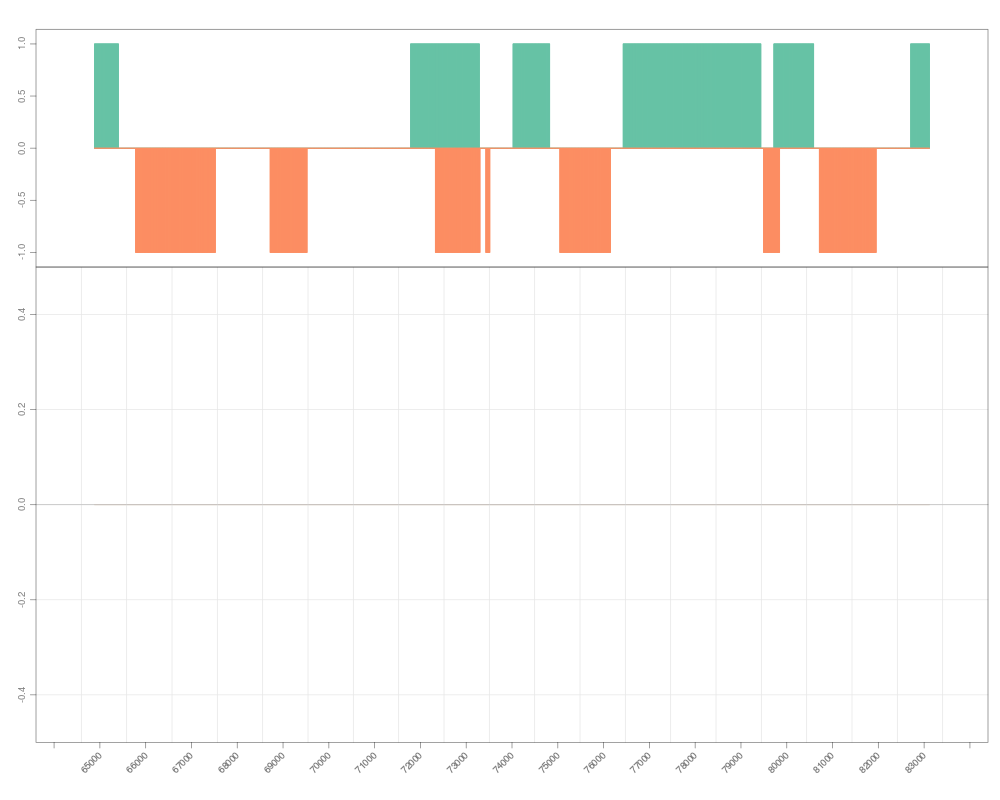
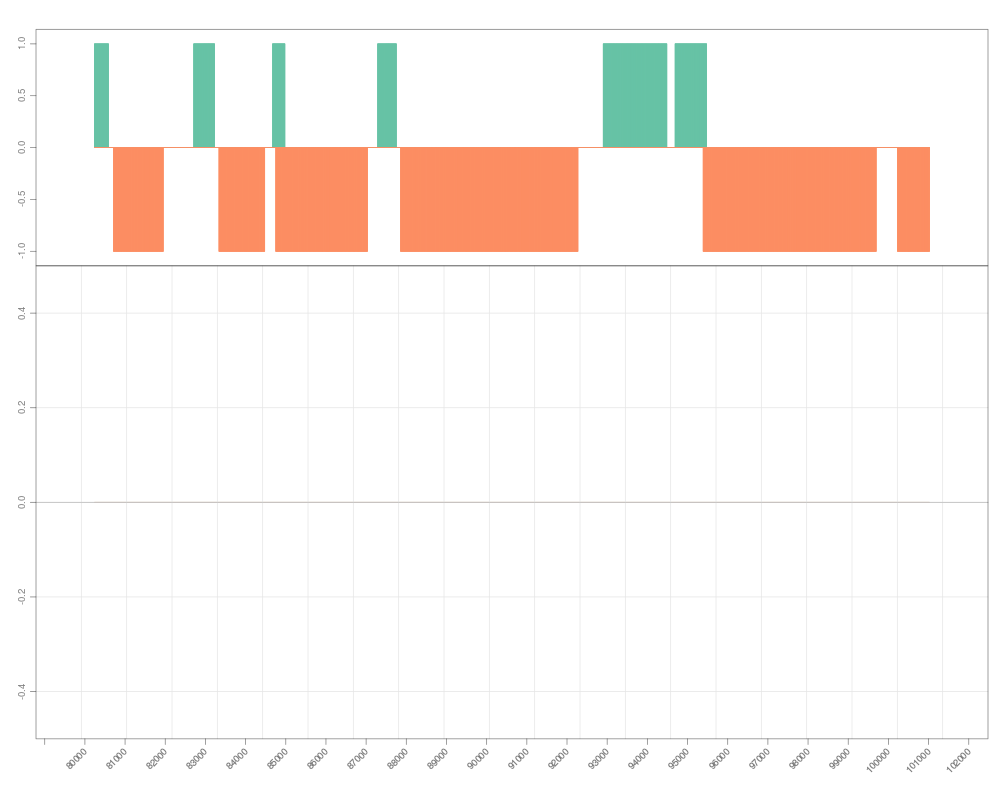
## grouping files and view by 'multifine_coverage'
which <- GRanges("chrI", IRanges(7e4, 7e4+8000))
s <- Snapshot(bfiles, range=which,
currentFunction="multifine_coverage", fac="sampleGroup")
Results
R version 3.3.1 (2016-06-21) -- "Bug in Your Hair"
Copyright (C) 2016 The R Foundation for Statistical Computing
Platform: x86_64-pc-linux-gnu (64-bit)

R is free software and comes with ABSOLUTELY NO WARRANTY.
You are welcome to redistribute it under certain conditions.
Type 'license()' or 'licence()' for distribution details.

R is a collaborative project with many contributors.
Type 'contributors()' for more information and
'citation()' on how to cite R or R packages in publications.

Type 'demo()' for some demos, 'help()' for on-line help, or
'help.start()' for an HTML browser interface to help.
Type 'q()' to quit R.

> library(ShortRead)
Loading required package: BiocGenerics
Loading required package: parallel

Attaching package: 'BiocGenerics'

The following objects are masked from 'package:parallel':

    clusterApply, clusterApplyLB, clusterCall, clusterEvalQ,
    clusterExport, clusterMap, parApply, parCapply, parLapply,
    parLapplyLB, parRapply, parSapply, parSapplyLB

The following objects are masked from 'package:stats':

    IQR, mad, xtabs

The following objects are masked from 'package:base':

    Filter, Find, Map, Position, Reduce, anyDuplicated, append,
    as.data.frame, cbind, colnames, do.call, duplicated, eval, evalq,
    get, grep, grepl, intersect, is.unsorted, lapply, lengths, mapply,
    match, mget, order, paste, pmax, pmax.int, pmin, pmin.int, rank,
    rbind, rownames, sapply, setdiff, sort, table, tapply, union,
    unique, unsplit

Loading required package: BiocParallel
Loading required package: Biostrings
Loading required package: S4Vectors
Loading required package: stats4

Attaching package: 'S4Vectors'

The following objects are masked from 'package:base':

    colMeans, colSums, expand.grid, rowMeans, rowSums

Loading required package: IRanges
Loading required package: XVector
Loading required package: Rsamtools
Loading required package: GenomeInfoDb
Loading required package: GenomicRanges
Loading required package: GenomicAlignments
Loading required package: SummarizedExperiment
Loading required package: Biobase
Welcome to Bioconductor

    Vignettes contain introductory material; view with
    'browseVignettes()'. To cite Bioconductor, see
    'citation("Biobase")', and for packages 'citation("pkgname")'.

> png(filename="/home/ddbj/snapshot/RGM3/R_BC/result/ShortRead/Snapshot-class.Rd_%03d_medium.png", width=480, height=480)
> ### Name: Snapshot-class
> ### Title: Class '"Snapshot"'
> ### Aliases: Snapshot-class trellis-class Snapshot
> ###   Snapshot,character,GRanges-method Snapshot,character,missing-method
> ###   Snapshot,BamFileList,GRanges-method files files,Snapshot-method
> ###   functions functions,Snapshot-method show,Snapshot-method view
> ###   view,Snapshot-method vrange vrange,Snapshot-method annTrack
> ###   annTrack,Snapshot-method fac fac,Snapshot-method getTrellis
> ###   getTrellis,Snapshot-method ignore.strand
> ###   ignore.strand,Snapshot-method pan pan,Snapshot-method togglefun
> ###   togglefun,Snapshot-method togglep togglep,Snapshot-method togglez
> ###   togglez,Snapshot-method zoom zoom,Snapshot-method
> ### Keywords: classes
>
> ### ** Examples
>
>
> ## example 1: Importing specific ranges of records
>
> file <- system.file("extdata", "SRR002051.chrI-V.bam",
+                     package="yeastNagalakshmi")
> which <-  GRanges("chrI", IRanges(1, 2e5))
> s <- Snapshot(file, range=which)
>
> ## methods
> zoom(s) # zoom in
> ## zoom in to a specific region
> zoom(s, range=GRanges("chrI", IRanges(7e4, 7e4+8000)))
> pan(s)  # pan right
> togglez(s) # change effect of zooming
> zoom(s) # zoom out
> togglep(s) # change effect of panning
> pan(s)
>
> ## accessors
> functions(s)
SnapshotFunctionList of length 4
names(4): fine_coverage coarse_coverage multifine_coverage multicoarse_coverage
> vrange(s)
GRanges object with 1 range and 0 metadata columns:
      seqnames         ranges strand
         <Rle>      <IRanges>  <Rle>
  [1]     chrI [50486, 74185]      *
  -------
  seqinfo: 1 sequence from an unspecified genome; no seqlengths
> show(s)
class: Snapshot
file(s): SRR002051.chrI-V.bam
Orginal range: chrI:1-200000
active range: chrI:50486-74185
zoom (togglez() to change): out
pan (togglep() to change): left
fun (togglefun() to change): coarse_coverage
functions: fine_coverage coarse_coverage multifine_coverage multicoarse_coverage
> ignore.strand(s)
[1] FALSE
> view(s) ## extract the spTrellis object
class: SpTrellis
region: 48829.77 75841.23
viewing window: 48829.77 75841.23
> getTrellis(s) ## extract the trellis object
>
> ## example 2: ignore strand
> s <- Snapshot(file, range=which, ignore.strand=TRUE)
>
> ##
> ## example 3: visualizing annotation track
> ##
>
> library(GenomicFeatures)
Loading required package: AnnotationDbi
>
> getAnnGR <- function(txdb, which) {
+     ex <- exonsBy(txdb, by="gene")
+     seqlevels(ex, force=TRUE) <- seqlevels(which)
+     r <- range(ex)
+     gr <- unlist(r)
+     values(gr)[["gene_id"]] <- rep.int(names(r), times=lengths(r))
+     gr
+ }
>
> txdbFile <- system.file("extdata", "sacCer2_sgdGene.sqlite",
+                     package="yeastNagalakshmi")
> # txdb <- makeTxDbFromUCSC(genome="sacCer2", tablename="sgdGene")
> txdb <- loadDb(txdbFile)
> which <-  GRanges("chrI", IRanges(1, 2e5))
> gr <- getAnnGR(txdb, which)
> ## note that the first column of the elementMetadata annotates of the
> ## range of the elements.
> gr
GRanges object with 118 ranges and 1 metadata column:
          seqnames           ranges strand |     gene_id
             <Rle>        <IRanges>  <Rle> | <character>
  YAL001C     chrI [147596, 151168]      - |     YAL001C
  YAL002W     chrI [143709, 147533]      + |     YAL002W
  YAL003W     chrI [142176, 143162]      + |     YAL003W
  YAL004W     chrI [140762, 141409]      + |     YAL004W
  YAL005C     chrI [139505, 141433]      - |     YAL005C
      ...      ...              ...    ... .         ...
  YAR068W     chrI [222397, 222882]      + |     YAR068W
  YAR069C     chrI [224002, 224295]      - |     YAR069C
  YAR070C     chrI [224554, 224853]      - |     YAR070C
  YAR071W     chrI [225451, 226854]      + |     YAR071W
  YAR073W     chrI [227733, 229308]      + |     YAR073W
  -------
  seqinfo: 1 sequence from sacCer2 genome
>
> s <- Snapshot(file, range=which, annTrack=gr)
> annTrack(s)
GRanges object with 118 ranges and 1 metadata column:
          seqnames           ranges strand |     gene_id
             <Rle>        <IRanges>  <Rle> | <character>
  YAL001C     chrI [147596, 151168]      - |     YAL001C
  YAL002W     chrI [143709, 147533]      + |     YAL002W
  YAL003W     chrI [142176, 143162]      + |     YAL003W
  YAL004W     chrI [140762, 141409]      + |     YAL004W
  YAL005C     chrI [139505, 141433]      - |     YAL005C
      ...      ...              ...    ... .         ...
  YAR068W     chrI [222397, 222882]      + |     YAR068W
  YAR069C     chrI [224002, 224295]      - |     YAR069C
  YAR070C     chrI [224554, 224853]      - |     YAR070C
  YAR071W     chrI [225451, 226854]      + |     YAR071W
  YAR073W     chrI [227733, 229308]      + |     YAR073W
  -------
  seqinfo: 1 sequence from sacCer2 genome
> ## zoom in to an interesting region
> zoom(s, range=GRanges("chrI", IRanges(7e4, 7e4+8000)))
>
> togglez(s) ## zoom out
> zoom(s)
>
> pan(s)
>
> ## example 4, 5, 6: multiple BAM files with 'multicoarse_covarage'
> ## and 'multifine_coverage' view.
>
> ## Resolution does not automatically switch for views of multiple
> ## files. It is important to note if width(which) < 10,000, use
> ## multifine_coverage.  Otherwise use multicoarse_coverage
> file <- system.file("extdata", "SRR002051.chrI-V.bam",
+                     package="yeastNagalakshmi")
> which <-  GRanges("chrI", IRanges(1, 2e5))
> s <- Snapshot(c(file, file), range=which,
+               currentFunction="multicoarse_coverage")
>
> ## grouping files and view by 'multicoarse_coverage'
> bfiles <- BamFileList(c(a=file, b=file))
> values(bfiles) <- DataFrame(sampleGroup=factor(c("normal", "tumor")))
> values(bfiles)
DataFrame with 2 rows and 1 column
  sampleGroup
     <factor>
1      normal
2       tumor
> s <- Snapshot(bfiles, range=which,
+               currentFunction="multicoarse_coverage", fac="sampleGroup")
>
> ## grouping files and view by 'multifine_coverage'
> which <- GRanges("chrI", IRanges(7e4, 7e4+8000))
> s <- Snapshot(bfiles, range=which,
+               currentFunction="multifine_coverage", fac="sampleGroup")
>
>
>
>
>
>
> dev.off()
null device
          1
>


|