Supported by Dr. Osamu Ogasawara and  . . |
|
Last data update: 2014.03.03 |
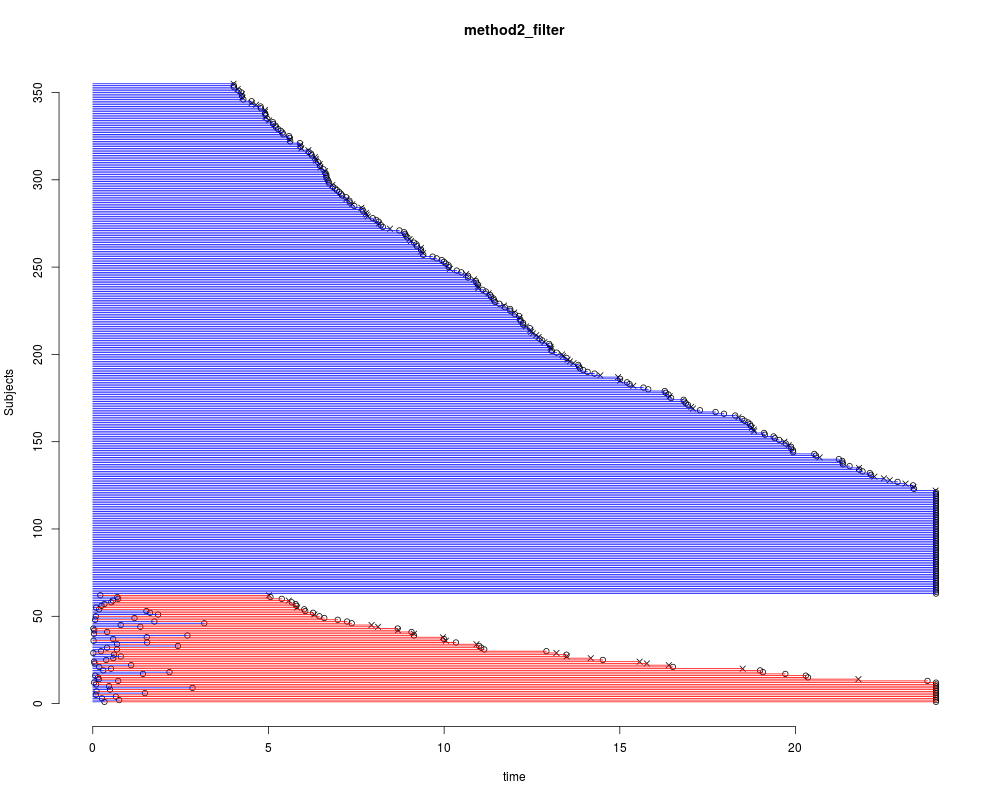
Make an incidence plot from simulated data.DescriptionCreate an incidence plot ordered by follow-up time from a survival data simulated. Usageplot_simuData(data, title="Sample Survival Data") Arguments
DetailsThis makes the incidence plot of the survival data based on the input dataframe from the tdSim.method1 or tdSim.method2 function. More generally, this function would also works with a dataframe containing survival data with the same columns name as indicated above. Author(s)Danyi Xiong, Teeranan Pokaprakarn, Hiroto Udagawa, Nusrat Rabbee Examples
dat <- tdSim.method2(500, duration=24,lambda12=1.3,lambda23=0.04,
    lambda13=0.03, exp.prop=0.2,rateC=0.05, min.futime=4, min.postexp.futime=4)

plot_simuData(dat, title='method2_filter')
Results
R version 3.3.1 (2016-06-21) -- "Bug in Your Hair"
Copyright (C) 2016 The R Foundation for Statistical Computing
Platform: x86_64-pc-linux-gnu (64-bit)

R is free software and comes with ABSOLUTELY NO WARRANTY.
You are welcome to redistribute it under certain conditions.
Type 'license()' or 'licence()' for distribution details.

R is a collaborative project with many contributors.
Type 'contributors()' for more information and
'citation()' on how to cite R or R packages in publications.

Type 'demo()' for some demos, 'help()' for on-line help, or
'help.start()' for an HTML browser interface to help.
Type 'q()' to quit R.

> library(SimHaz)
> png(filename="/home/ddbj/snapshot/RGM3/R_CC/result/SimHaz/plot_simuData.Rd_%03d_medium.png", width=480, height=480)
> ### Name: plot_simuData
> ### Title: Make an incidence plot from simulated data.
> ### Aliases: plot_simuData
> ### Keywords: Plot
>
> ### ** Examples
>
> dat <- tdSim.method2(500, duration=24,lambda12=1.3,lambda23=0.04,
+     lambda13=0.03, exp.prop=0.2,rateC=0.05, min.futime=4, min.postexp.futime=4)
>
> plot_simuData(dat, title='method2_filter')
>
>
>
>
>
> dev.off()
null device
          1
>
|
Created & Maintained by Osamu Ogasawara (osamu.ogasawara@gmail.com) and 