R version 3.3.1 (2016-06-21) -- "Bug in Your Hair"
Copyright (C) 2016 The R Foundation for Statistical Computing
Platform: x86_64-pc-linux-gnu (64-bit)
R is free software and comes with ABSOLUTELY NO WARRANTY.
You are welcome to redistribute it under certain conditions.
Type 'license()' or 'licence()' for distribution details.
R is a collaborative project with many contributors.
Type 'contributors()' for more information and
'citation()' on how to cite R or R packages in publications.
Type 'demo()' for some demos, 'help()' for on-line help, or
'help.start()' for an HTML browser interface to help.
Type 'q()' to quit R.
> library(SixSigma)
> png(filename="/home/ddbj/snapshot/RGM3/R_CC/result/SixSigma/outProfiles.Rd_%03d_medium.png", width=480, height=480)
> ### Name: outProfiles
> ### Title: Get out-of-control profiles
> ### Aliases: outProfiles
>
> ### ** Examples
>
> wby.phase1 <- ss.data.wby[, 1:35]
> wb.limits <- climProfiles(profiles = wby.phase1,
+ x = ss.data.wbx,
+ smoothprof = TRUE,
+ smoothlim = TRUE)
> wby.phase2 <- ss.data.wby[, 36:50]
> wb.out.phase2 <- outProfiles(profiles = wby.phase2,
+ x = ss.data.wbx,
+ cLimits = wb.limits,
+ tol = 0.8)
> wb.out.phase2
$labOut
[1] "P47"
$idOut
[1] 12
$pOut
[1] 0.00 0.00 0.00 0.00 0.00 0.01 0.00 0.00 0.00 0.00 0.00 0.95 0.00 0.00 0.00
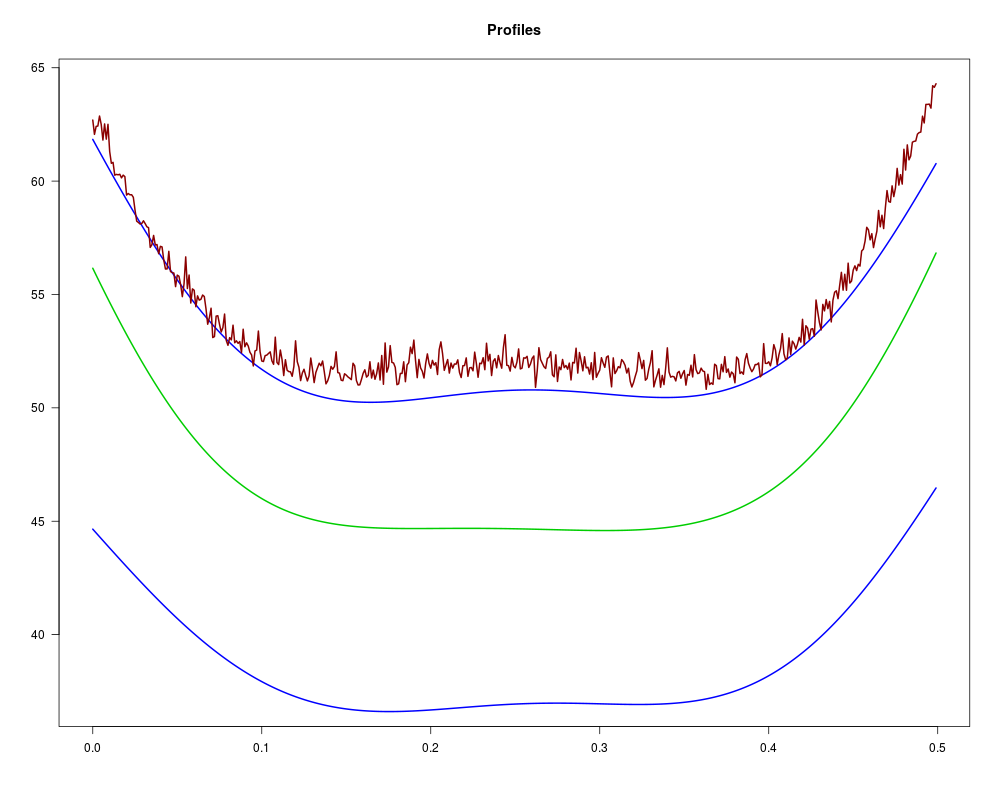
> plotProfiles(wby.phase2,
+ x = ss.data.wbx,
+ cLimits = wb.limits,
+ outControl = wb.out.phase2$idOut,
+ onlyout = TRUE)
>
>
>
>
>
> dev.off()
null device
1
>
 .
.