Supported by Dr. Osamu Ogasawara and  . . |
|
Last data update: 2014.03.03 |
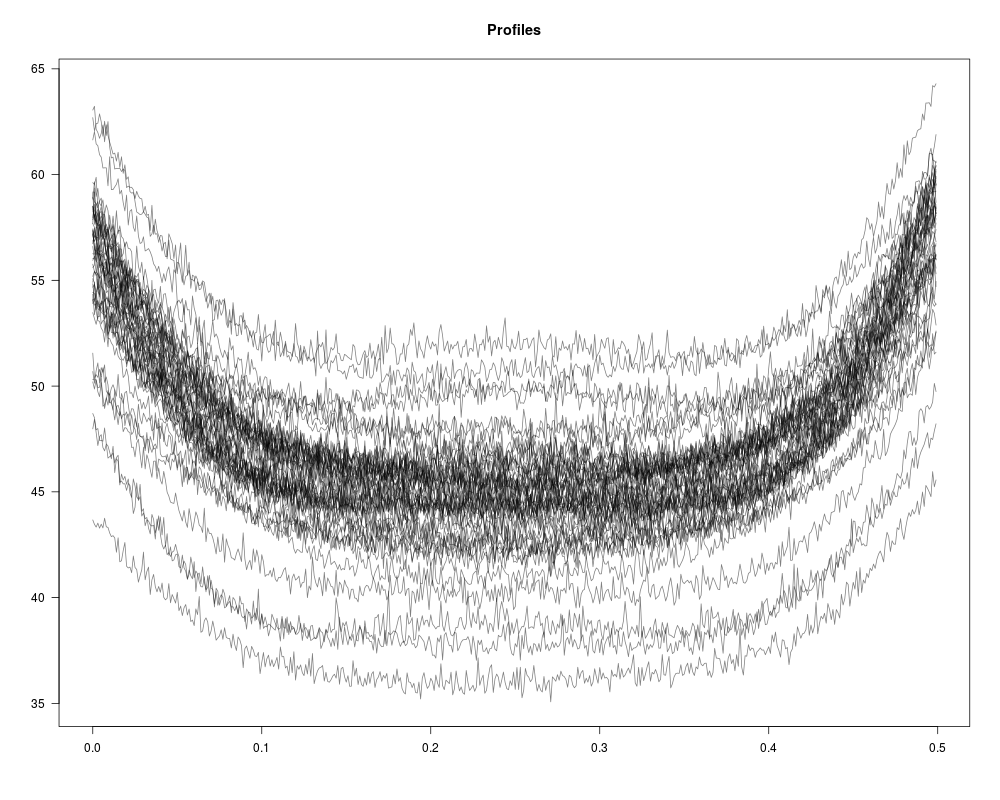
Plot ProfilesDescriptionPlot profiles and optionally control limits UsageplotProfiles(profiles, x = 1:nrow(profiles), cLimits = NULL, outControl = NULL, onlyout = FALSE) Arguments
ValueOnly graphical output with the profiles Author(s)Javier M. Moguerza and Emilio L. Cano ReferencesCano, E.L. and Moguerza, J.M. and Prieto Corcoba, M. (2015) Quality Control with R. An ISO Standards Approach. Springer. Examples
plotProfiles(profiles = ss.data.wby,
    x = ss.data.wbx)
Results
R version 3.3.1 (2016-06-21) -- "Bug in Your Hair"
Copyright (C) 2016 The R Foundation for Statistical Computing
Platform: x86_64-pc-linux-gnu (64-bit)

R is free software and comes with ABSOLUTELY NO WARRANTY.
You are welcome to redistribute it under certain conditions.
Type 'license()' or 'licence()' for distribution details.

R is a collaborative project with many contributors.
Type 'contributors()' for more information and
'citation()' on how to cite R or R packages in publications.

Type 'demo()' for some demos, 'help()' for on-line help, or
'help.start()' for an HTML browser interface to help.
Type 'q()' to quit R.

> library(SixSigma)
> png(filename="/home/ddbj/snapshot/RGM3/R_CC/result/SixSigma/plotProfiles.Rd_%03d_medium.png", width=480, height=480)
> ### Name: plotProfiles
> ### Title: Plot Profiles
> ### Aliases: plotProfiles
>
> ### ** Examples
>
> plotProfiles(profiles = ss.data.wby,
+     x = ss.data.wbx)
>
>
>
>
>
> dev.off()
null device
          1
>
|
Created & Maintained by Osamu Ogasawara (osamu.ogasawara@gmail.com) and 