Supported by Dr. Osamu Ogasawara and  . . |
|
Last data update: 2014.03.03 |
Control ChartsDescriptionPlot control charts Usagess.cc(type, data, cdata, CTQ = names(data)[1], groups, climits, nsigmas = 3) Arguments
DetailsIf control limits are provided,
ValueA plot with the control chart, and a list with the following elements:
NoteWe have created this function since the Author(s)EL Cano ReferencesCano, Emilio L., Moguerza, Javier M. and Redchuk, Andres. 2012. Six Sigma with R. Statistical Engineering for Process Improvement, Use R!, vol. 36. Springer, New York. http://www.springer.com/statistics/book/978-1-4614-3651-5. See Also
Examples
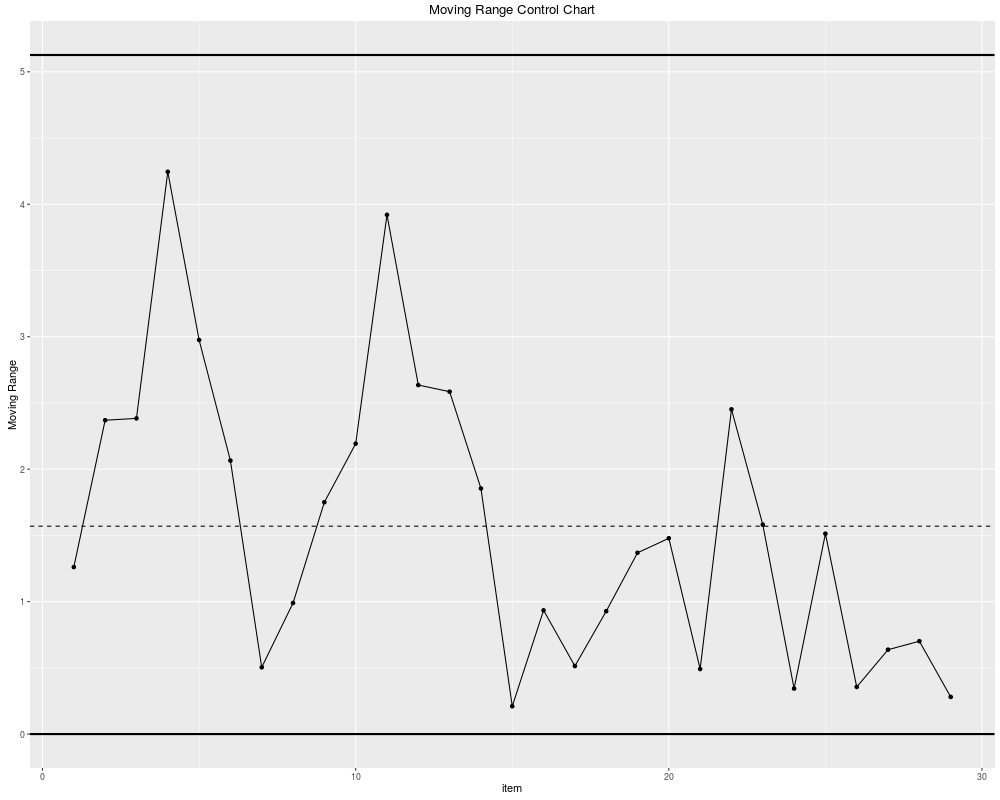
ss.cc("mr", ss.data.pb1, CTQ = "pb.humidity")
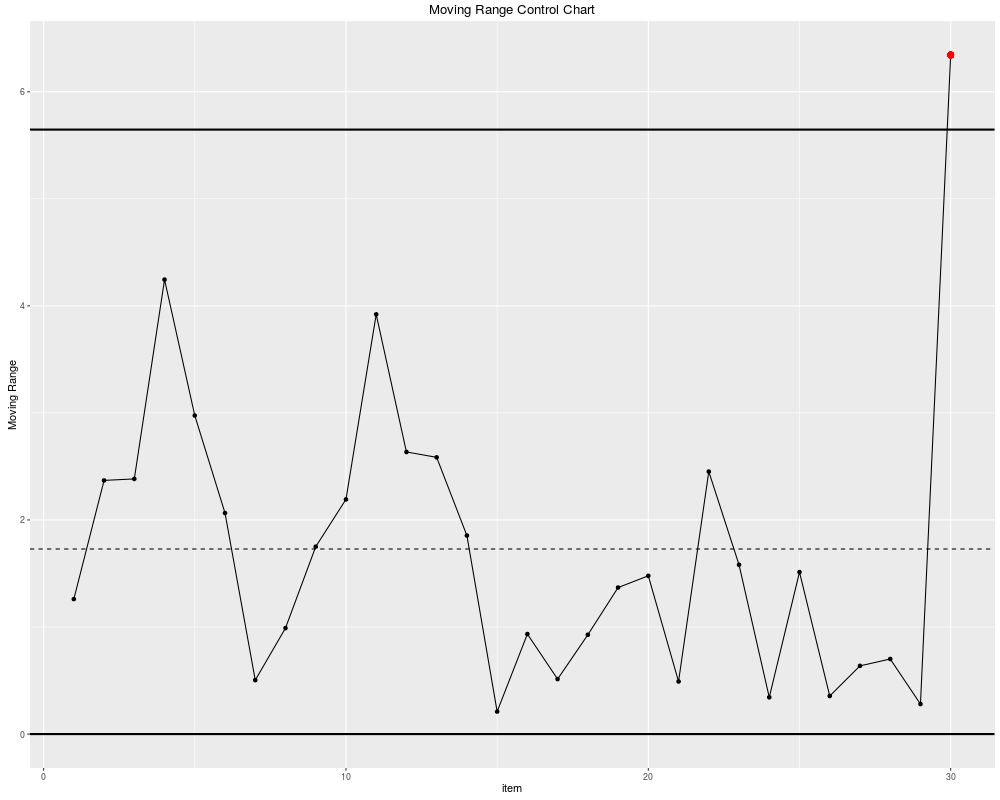
testout <- ss.data.pb1
testout[31,] <- list(31,17)
ss.cc("mr", testout, CTQ = "pb.humidity")
Results
R version 3.3.1 (2016-06-21) -- "Bug in Your Hair"
Copyright (C) 2016 The R Foundation for Statistical Computing
Platform: x86_64-pc-linux-gnu (64-bit)

R is free software and comes with ABSOLUTELY NO WARRANTY.
You are welcome to redistribute it under certain conditions.
Type 'license()' or 'licence()' for distribution details.

R is a collaborative project with many contributors.
Type 'contributors()' for more information and
'citation()' on how to cite R or R packages in publications.

Type 'demo()' for some demos, 'help()' for on-line help, or
'help.start()' for an HTML browser interface to help.
Type 'q()' to quit R.

> library(SixSigma)
> png(filename="/home/ddbj/snapshot/RGM3/R_CC/result/SixSigma/ss.cc.Rd_%03d_medium.png", width=480, height=480)
> ### Name: ss.cc
> ### Title: Control Charts
> ### Aliases: ss.cc
>
> ### ** Examples
>
> ss.cc("mr", ss.data.pb1, CTQ = "pb.humidity")
Phase I limits:
     LCL       CL      UCL
0.000000 1.569483 5.126767

Out of control Moving Range:
None
> testout <- ss.data.pb1
> testout[31,] <- list(31,17)
> ss.cc("mr", testout, CTQ = "pb.humidity")
Phase I limits:
     LCL       CL      UCL
0.000000 1.728600 5.646528

Out of control Moving Range:
[1] 30
>
>
>
>
>
>
> dev.off()
null device
          1
>
|