Supported by Dr. Osamu Ogasawara and  . . |
|
Last data update: 2014.03.03 |
Cause and Effect DiagramDescriptionRepresents a Cause and Effect Diagram by cause group. Usage
ss.ceDiag(effect, causes.gr, causes,
  main = "Six Sigma Cause-and-effect Diagram", sub, ss.col = c("#666666",
  "#BBBBBB", "#CCCCCC", "#DDDDDD", "#EEEEEE"))
Arguments
DetailsThe default value for ss.col is c("#666666", "#BBBBBB", "#CCCCCC", "#DDDDDD", "#EEEEEE"), a grayscale style. You can pass any accepted colour string. ValueA drawing of the causes and effect with "fish-bone" shape NoteThe cause and effect diagram is also known as "Ishikawa diagram", and has been widely used in Quality Management. It is one of the Seven Basic Tools of Quality. Author(s)EL Cano ReferencesCano, Emilio L., Moguerza, Javier M. and Redchuk, Andres. 2012.
Six Sigma with R. Statistical Engineering for Process
Improvement, Use R!, vol. 36. Springer, New York.
http://www.springer.com/statistics/book/978-1-4614-3651-5. Wikipedia, http://en.wikipedia.org/wiki/Ishikawa_diagram See Also
Examples
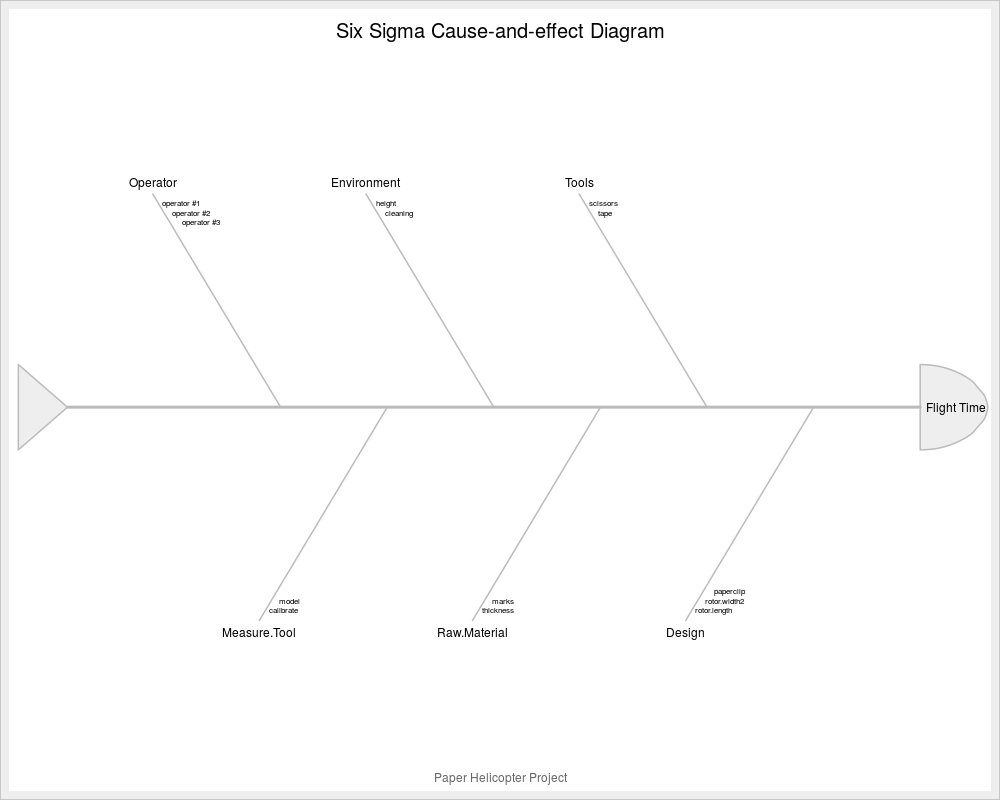
effect <- "Flight Time"
causes.gr <- c("Operator", "Environment", "Tools", "Design",
  "Raw.Material", "Measure.Tool")
causes <- vector(mode = "list", length = length(causes.gr))
causes[1] <- list(c("operator #1", "operator #2", "operator #3"))
causes[2] <- list(c("height", "cleaning"))
causes[3] <- list(c("scissors", "tape"))
causes[4] <- list(c("rotor.length", "rotor.width2", "paperclip"))
causes[5] <- list(c("thickness", "marks"))
causes[6] <- list(c("calibrate", "model"))
ss.ceDiag(effect, causes.gr, causes, sub = "Paper Helicopter Project")
Results
R version 3.3.1 (2016-06-21) -- "Bug in Your Hair"
Copyright (C) 2016 The R Foundation for Statistical Computing
Platform: x86_64-pc-linux-gnu (64-bit)

R is free software and comes with ABSOLUTELY NO WARRANTY.
You are welcome to redistribute it under certain conditions.
Type 'license()' or 'licence()' for distribution details.

R is a collaborative project with many contributors.
Type 'contributors()' for more information and
'citation()' on how to cite R or R packages in publications.

Type 'demo()' for some demos, 'help()' for on-line help, or
'help.start()' for an HTML browser interface to help.
Type 'q()' to quit R.

> library(SixSigma)
> png(filename="/home/ddbj/snapshot/RGM3/R_CC/result/SixSigma/ss.ceDiag.Rd_%03d_medium.png", width=480, height=480)
> ### Name: ss.ceDiag
> ### Title: Cause and Effect Diagram
> ### Aliases: ss.ceDiag
> ### Keywords: cause-and-effect
>
> ### ** Examples
>
> effect <- "Flight Time"
> causes.gr <- c("Operator", "Environment", "Tools", "Design",
+   "Raw.Material", "Measure.Tool")
> causes <- vector(mode = "list", length = length(causes.gr))
> causes[1] <- list(c("operator #1", "operator #2", "operator #3"))
> causes[2] <- list(c("height", "cleaning"))
> causes[3] <- list(c("scissors", "tape"))
> causes[4] <- list(c("rotor.length", "rotor.width2", "paperclip"))
> causes[5] <- list(c("thickness", "marks"))
> causes[6] <- list(c("calibrate", "model"))
> ss.ceDiag(effect, causes.gr, causes, sub = "Paper Helicopter Project")
>
>
>
>
>
>
> dev.off()
null device
          1
>
|