Supported by Dr. Osamu Ogasawara and  . . |
|
Last data update: 2014.03.03 |
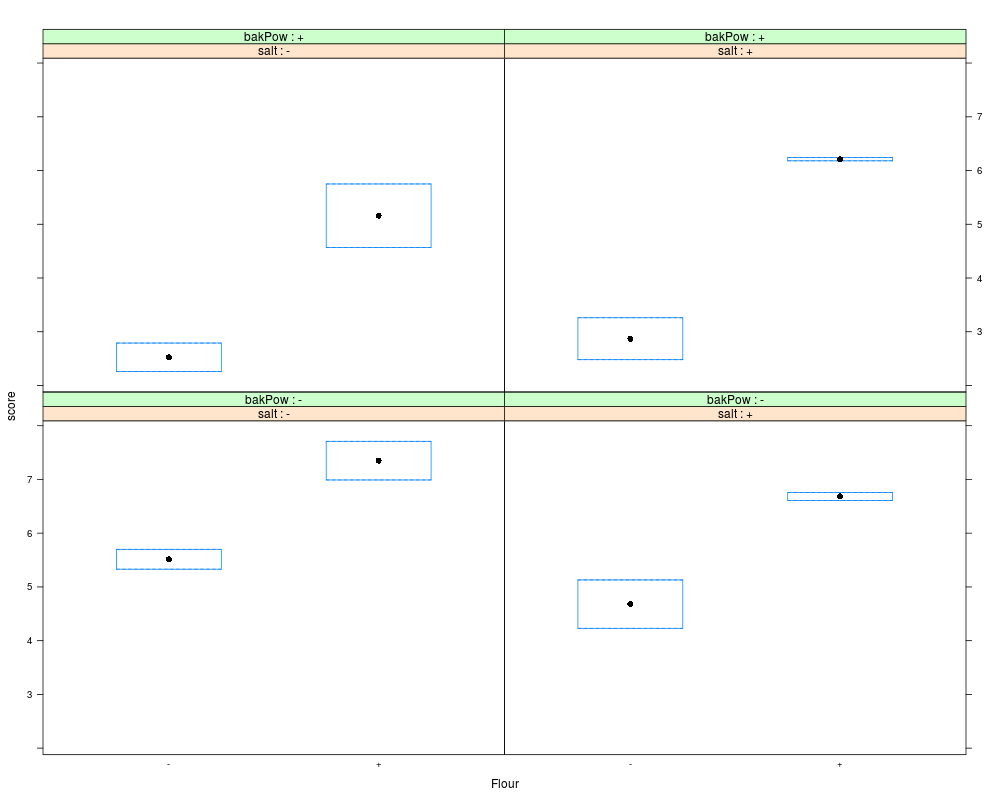
Pizza dough example dataDescriptionExperimental data for the scores given to a set of pizza doughs. Usagedata(ss.data.doe1) FormatA data frame with 16 observations on the following 6 variables.
NoteThis data set is used in chapter 11 of the book “Six Sigma with R” (see References). SourceSee references. ReferencesCano, Emilio L., Moguerza, Javier M. and Redchuk, Andr<c3><83><c2><a9>s. 2012.
Six Sigma with R. Statistical Engineering for Process
Improvement, Use R!, vol. 36. Springer, New York.
http://www.springer.com/statistics/book/978-1-4614-3651-5. Examplesdata(ss.data.doe1) summary(ss.data.doe1) lattice::bwplot(score ~ flour | salt + bakPow , data = ss.data.doe1, xlab = "Flour", strip = function(..., style) lattice::strip.default(..., strip.names=c(TRUE,TRUE))) Results
R version 3.3.1 (2016-06-21) -- "Bug in Your Hair"
Copyright (C) 2016 The R Foundation for Statistical Computing
Platform: x86_64-pc-linux-gnu (64-bit)

R is free software and comes with ABSOLUTELY NO WARRANTY.
You are welcome to redistribute it under certain conditions.
Type 'license()' or 'licence()' for distribution details.

R is a collaborative project with many contributors.
Type 'contributors()' for more information and
'citation()' on how to cite R or R packages in publications.

Type 'demo()' for some demos, 'help()' for on-line help, or
'help.start()' for an HTML browser interface to help.
Type 'q()' to quit R.

> library(SixSigma)
> png(filename="/home/ddbj/snapshot/RGM3/R_CC/result/SixSigma/ss.data.doe1.Rd_%03d_medium.png", width=480, height=480)
> ### Name: ss.data.doe1
> ### Title: Pizza dough example data
> ### Aliases: ss.data.doe1
> ### Keywords: data doe
>
> ### ** Examples
>
> data(ss.data.doe1)
> summary(ss.data.doe1)
      repl     flour salt  bakPow     score            ord
 Min.   :1.0   -:8   -:8   -:8    Min.   :2.260   Min.   :1.00
 1st Qu.:1.0   +:8   +:8   +:8    1st Qu.:3.987   1st Qu.:2.75
 Median :1.5                      Median :5.515   Median :4.50
 Mean   :1.5                      Mean   :5.124   Mean   :4.50
 3rd Qu.:2.0                      3rd Qu.:6.332   3rd Qu.:6.25
 Max.   :2.0                      Max.   :7.710   Max.   :8.00
> lattice::bwplot(score ~ flour | salt + bakPow ,
+  data = ss.data.doe1,
+  xlab = "Flour",
+  strip = function(..., style) lattice::strip.default(..., strip.names=c(TRUE,TRUE)))
>
>
>
>
>
>
> dev.off()
null device
          1
>
|
Created & Maintained by Osamu Ogasawara (osamu.ogasawara@gmail.com) and 