Supported by Dr. Osamu Ogasawara and  . . |
|
Last data update: 2014.03.03 |
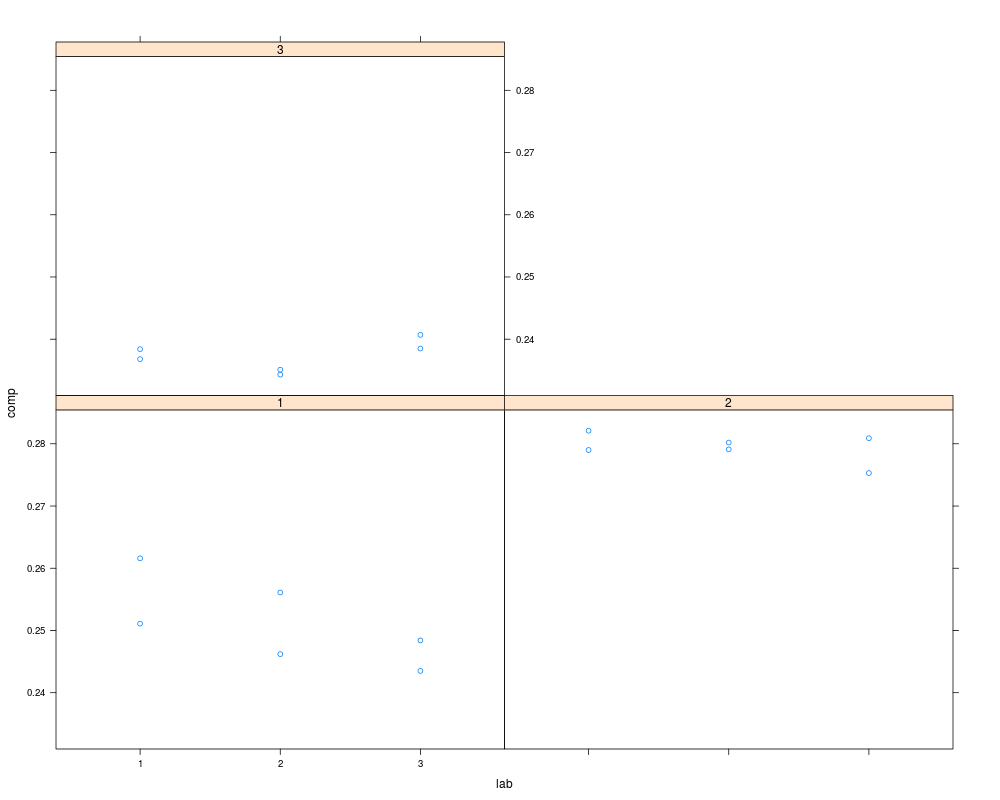
Pastries dataDescriptionA data frame with 18 observations of the amount of the CTQ compound in some pastries from a bakery. There are two runs for each combination of two factors (laboratory and batch). Usagedata(ss.data.pastries) FormatA data frame with 18 observations on the following 4 variables.
NoteThis data set is used in chapter 5 exercises of the book “Six Sigma with R” (see References). SourceSee references. ReferencesCano, Emilio L., Moguerza, Javier M. and Redchuk, Andr<c3><83><c2><a9>s. 2012.
Six Sigma with R. Statistical Engineering for Process
Improvement, Use R!, vol. 36. Springer, New York.
http://www.springer.com/statistics/book/978-1-4614-3651-5. Examplesdata(ss.data.pastries) summary(ss.data.pastries) lattice::xyplot(comp ~ lab | batch, data = ss.data.pastries) Results
R version 3.3.1 (2016-06-21) -- "Bug in Your Hair"
Copyright (C) 2016 The R Foundation for Statistical Computing
Platform: x86_64-pc-linux-gnu (64-bit)

R is free software and comes with ABSOLUTELY NO WARRANTY.
You are welcome to redistribute it under certain conditions.
Type 'license()' or 'licence()' for distribution details.

R is a collaborative project with many contributors.
Type 'contributors()' for more information and
'citation()' on how to cite R or R packages in publications.

Type 'demo()' for some demos, 'help()' for on-line help, or
'help.start()' for an HTML browser interface to help.
Type 'q()' to quit R.

> library(SixSigma)
> png(filename="/home/ddbj/snapshot/RGM3/R_CC/result/SixSigma/ss.data.pastries.Rd_%03d_medium.png", width=480, height=480)
> ### Name: ss.data.pastries
> ### Title: Pastries data
> ### Aliases: ss.data.pastries
> ### Keywords: data msa
>
> ### ** Examples
>
> data(ss.data.pastries)
> summary(ss.data.pastries)
 lab   batch run        comp
 1:6   1:6   1:9   Min.   :0.2343
 2:6   2:6   2:9   1st Qu.:0.2391
 3:6   3:6         Median :0.2497
                   Mean   :0.2560
                   3rd Qu.:0.2781
                   Max.   :0.2821
> lattice::xyplot(comp ~ lab | batch, data = ss.data.pastries)
>
>
>
>
>
>
> dev.off()
null device
          1
>
|