Supported by Dr. Osamu Ogasawara and  . . |
|
Last data update: 2014.03.03 |
Particle Boards Example - Individual DataDescriptionHumidity of 30 raw material used to make particle boards for individual control chart. Usagedata(ss.data.pb1) FormatA data frame with 30 observations on the following 2 variables.
NoteThis data set is used in chapter 12 of the book “Six Sigma with R” (see References). SourceSee references. ReferencesCano, Emilio L., Moguerza, Javier M. and Redchuk, Andr<c3><83><c2><a9>s. 2012.
Six Sigma with R. Statistical Engineering for Process
Improvement, Use R!, vol. 36. Springer, New York.
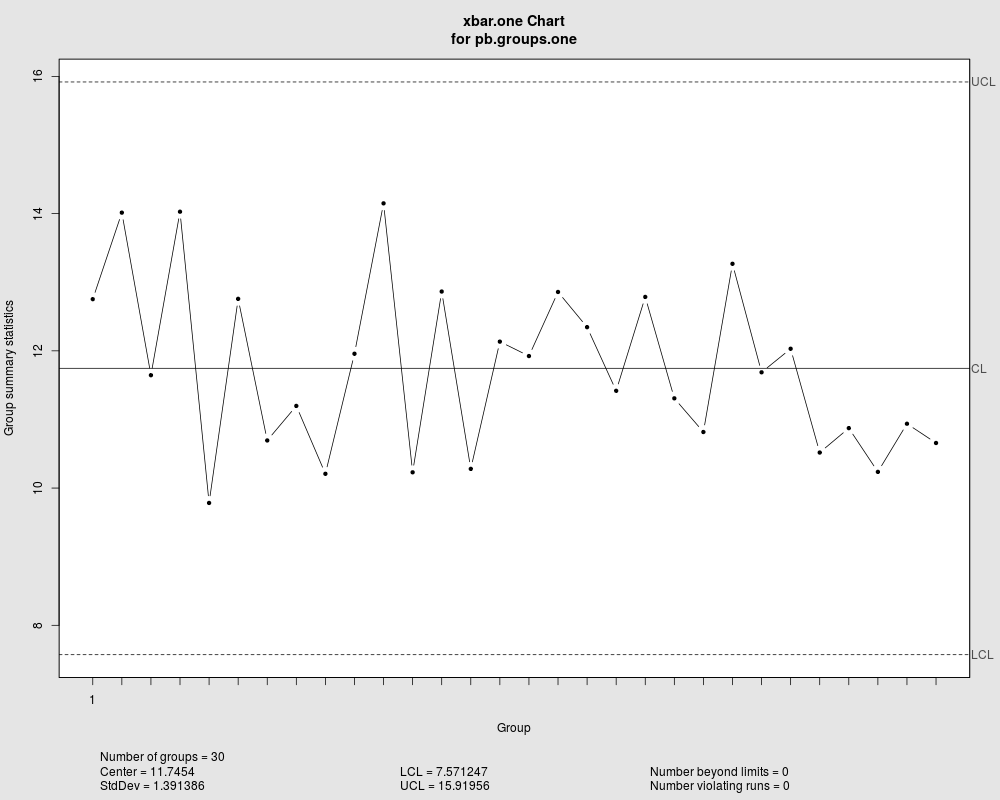
http://www.springer.com/statistics/book/978-1-4614-3651-5. Examplesdata(ss.data.pb1) summary(ss.data.pb1) library(qcc) pb.groups.one <- with(ss.data.pb1, qcc.groups(pb.humidity, pb.group)) pb.xbar.one <- qcc(pb.groups.one, type="xbar.one") summary(pb.xbar.one) plot(pb.xbar.one) Results
R version 3.3.1 (2016-06-21) -- "Bug in Your Hair"
Copyright (C) 2016 The R Foundation for Statistical Computing
Platform: x86_64-pc-linux-gnu (64-bit)

R is free software and comes with ABSOLUTELY NO WARRANTY.
You are welcome to redistribute it under certain conditions.
Type 'license()' or 'licence()' for distribution details.

R is a collaborative project with many contributors.
Type 'contributors()' for more information and
'citation()' on how to cite R or R packages in publications.

Type 'demo()' for some demos, 'help()' for on-line help, or
'help.start()' for an HTML browser interface to help.
Type 'q()' to quit R.

> library(SixSigma)
> png(filename="/home/ddbj/snapshot/RGM3/R_CC/result/SixSigma/ss.data.pb1.Rd_%03d_medium.png", width=480, height=480)
> ### Name: ss.data.pb1
> ### Title: Particle Boards Example - Individual Data
> ### Aliases: ss.data.pb1
> ### Keywords: cc data
>
> ### ** Examples
>
> data(ss.data.pb1)
> summary(ss.data.pb1)
    pb.group      pb.humidity
 Min.   : 1.00   Min.   : 9.783
 1st Qu.: 8.25   1st Qu.:10.725
 Median :15.50   Median :11.666
 Mean   :15.50   Mean   :11.745
 3rd Qu.:22.75   3rd Qu.:12.757
 Max.   :30.00   Max.   :14.150
> library(qcc)
Package 'qcc', version 2.6
Type 'citation("qcc")' for citing this R package in publications.
> pb.groups.one <- with(ss.data.pb1, qcc.groups(pb.humidity, pb.group))
> pb.xbar.one <- qcc(pb.groups.one, type="xbar.one")
> summary(pb.xbar.one)

Call:
qcc(data = pb.groups.one, type = "xbar.one")

xbar.one chart for pb.groups.one

Summary of group statistics:
   Min. 1st Qu.  Median    Mean 3rd Qu.    Max.
  9.783  10.720  11.670  11.750  12.760  14.150

Group sample size:  30
Number of groups:  30
Center of group statistics:  11.7454
Standard deviation:  1.391386

Control limits:
      LCL      UCL
 7.571247 15.91956
> plot(pb.xbar.one)
>
>
>
>
>
>
> dev.off()
null device
          1
>
|

Created & Maintained by Osamu Ogasawara (osamu.ogasawara@gmail.com) and 