Supported by Dr. Osamu Ogasawara and  . . |
|
Last data update: 2014.03.03 |
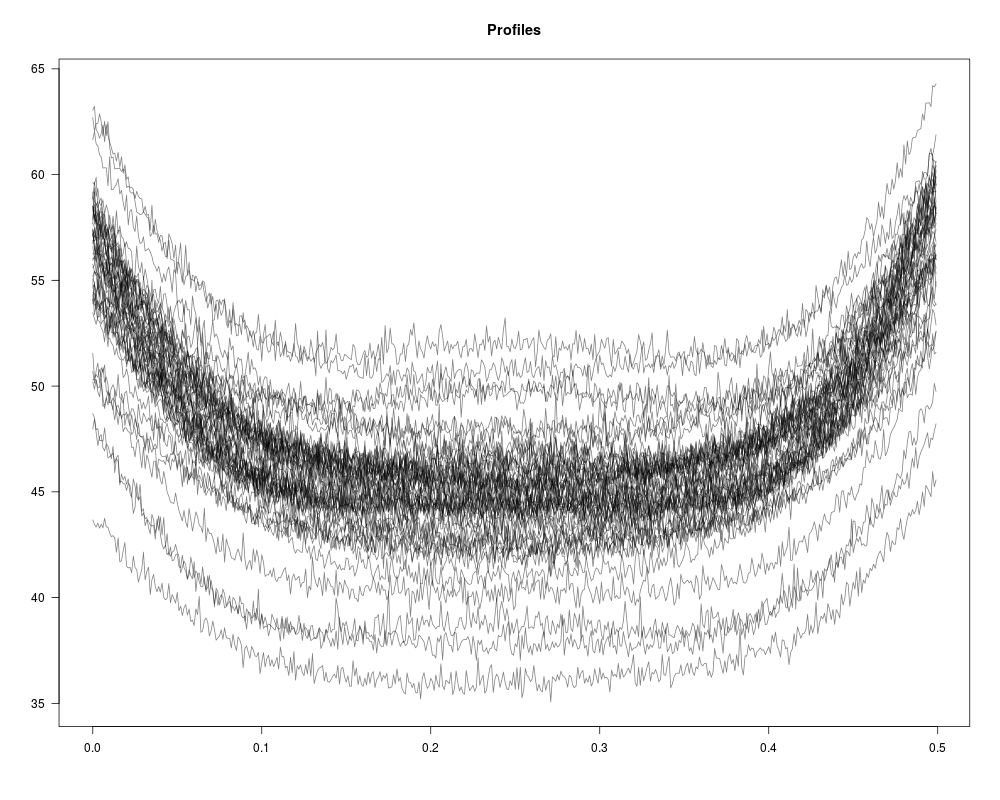
Woodboard profilesDescriptionThis data set contains 50 profiles corresponding to the density measurements of 50 0.5in-thick engineered woodboard, measured in 500 locations. Usage
data("ss.data.wby")
FormatA matrix with 500 rows (locations) and 50 columns (woodboard). DetailsThis data set illustrates concepts in the book “Quality Control with R”.
This data set should be used along with the SourceExample 10.1 in the reference below. It is a variation of the one introduced by Walker (2002). ReferencesCano, E.L. and Moguerza, J.M. and Prieto Corcoba, M. (2015) Quality Control with R. An ISO Standards Approach. Springer. Walker, E. amd Wright, W (2002) Comparing curves with additive models. J. Qual. Technol. 34(1), 118–129 See Also
Examples
data(ss.data.wbx)
data(ss.data.wby)
plotProfiles(profiles = ss.data.wby,
    x = ss.data.wbx)
Results
R version 3.3.1 (2016-06-21) -- "Bug in Your Hair"
Copyright (C) 2016 The R Foundation for Statistical Computing
Platform: x86_64-pc-linux-gnu (64-bit)

R is free software and comes with ABSOLUTELY NO WARRANTY.
You are welcome to redistribute it under certain conditions.
Type 'license()' or 'licence()' for distribution details.

R is a collaborative project with many contributors.
Type 'contributors()' for more information and
'citation()' on how to cite R or R packages in publications.

Type 'demo()' for some demos, 'help()' for on-line help, or
'help.start()' for an HTML browser interface to help.
Type 'q()' to quit R.

> library(SixSigma)
> png(filename="/home/ddbj/snapshot/RGM3/R_CC/result/SixSigma/ss.data.wby.Rd_%03d_medium.png", width=480, height=480)
> ### Name: ss.data.wby
> ### Title: Woodboard profiles
> ### Aliases: ss.data.wby
> ### Keywords: datasets
>
> ### ** Examples
>
>
> data(ss.data.wbx)
> data(ss.data.wby)
> plotProfiles(profiles = ss.data.wby,
+     x = ss.data.wbx)
>
>
>
>
>
> dev.off()
null device
          1
>
|
Created & Maintained by Osamu Ogasawara (osamu.ogasawara@gmail.com) and 