Supported by Dr. Osamu Ogasawara and  . . |
|
Last data update: 2014.03.03 |
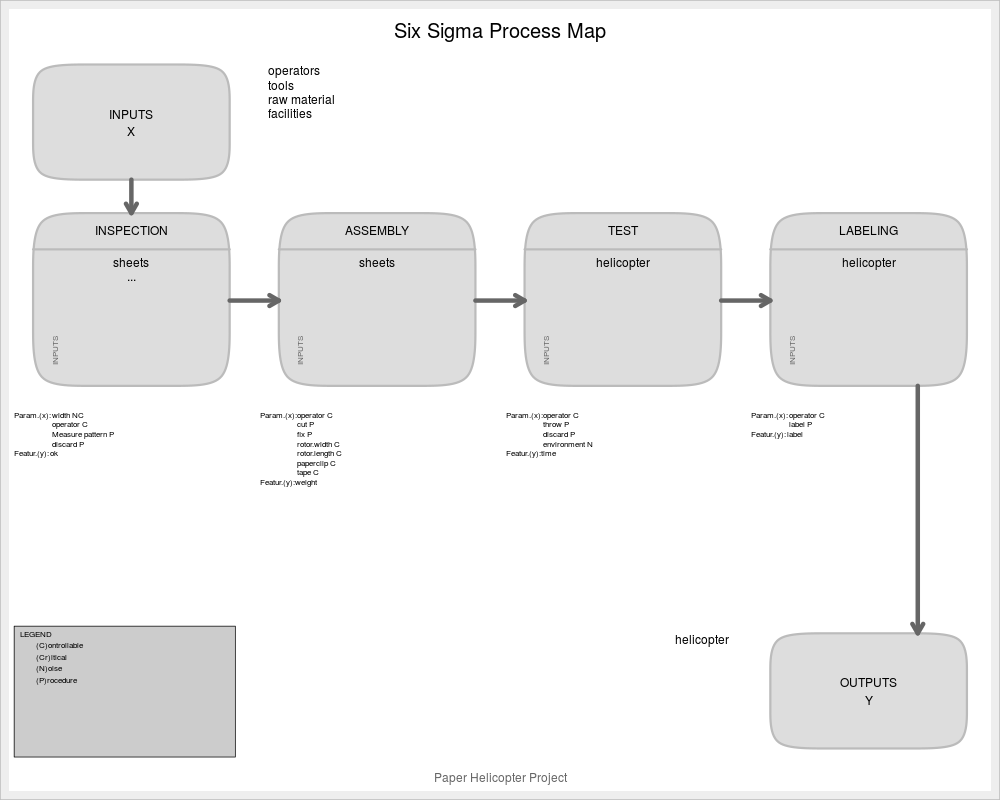
Process MapDescriptionThis function takes information about the process we want to represent and draw the Process Map, with its X's, x's, Y's and y's in each step of the process Usage
ss.pMap(steps, inputs.overall, outputs.overall, input.output, x.parameters,
  y.features, main = "Six Sigma Process Map", sub, ss.col = c("#666666",
  "#BBBBBB", "#CCCCCC", "#DDDDDD", "#EEEEEE"))
Arguments
DetailsThe type of the x parameters and y features can be: C(controllable), N(noise), Cr(Critical), P(Procedure). The default value for ss.col is c("#666666", "#BBBBBB", "#CCCCCC", "#DDDDDD", "#EEEEEE"), a grayscale style. You can pass any accepted color string. ValueA graphic representation of the Map Process. NoteThe process map is the starting point for a Six Sigma Project, and it is very important to find out who the x's and y'x are. Author(s)EL Cano Referenceshttp://en.wikipedia.org/wiki/Business_Process_Mapping Cano, Emilio L., Moguerza, Javier M. and Redchuk, Andres. 2012.
Six Sigma with R. Statistical Engineering for Process
Improvement, Use R!, vol. 36. Springer, New York.
http://www.springer.com/statistics/book/978-1-4614-3651-5. See Also
Examples
inputs.overall<-c("operators", "tools", "raw material", "facilities")
outputs.overall<-c("helicopter")
steps<-c("INSPECTION", "ASSEMBLY", "TEST", "LABELING")
#Inputs of process "i" are inputs of process "i+1"
input.output<-vector(mode="list",length=length(steps))
input.output[1]<-list(c("sheets", "..."))
input.output[2]<-list(c("sheets"))
input.output[3]<-list(c("helicopter"))
input.output[4]<-list(c("helicopter"))

#Parameters of each process
x.parameters<-vector(mode="list",length=length(steps))
x.parameters[1]<-list(c(list(c("width", "NC")),list(c("operator", "C")),
list(c("Measure pattern", "P")), list(c("discard", "P"))))
x.parameters[2]<-list(c(list(c("operator", "C")),list(c("cut", "P")),
list(c("fix", "P")), list(c("rotor.width", "C")),list(c("rotor.length",
"C")), list(c("paperclip", "C")), list(c("tape", "C"))))
x.parameters[3]<-list(c(list(c("operator", "C")),list(c("throw", "P")),
list(c("discard", "P")), list(c("environment", "N"))))
x.parameters[4]<-list(c(list(c("operator", "C")),list(c("label", "P"))))
x.parameters

#Features of each process
y.features<-vector(mode="list",length=length(steps))
y.features[1]<-list(c(list(c("ok", "Cr"))))
y.features[2]<-list(c(list(c("weight", "Cr"))))
y.features[3]<-list(c(list(c("time", "Cr"))))
y.features[4]<-list(c(list(c("label", "Cr"))))
y.features

ss.pMap(steps, inputs.overall, outputs.overall,
        input.output, x.parameters, y.features,
        sub="Paper Helicopter Project")
Results
R version 3.3.1 (2016-06-21) -- "Bug in Your Hair"
Copyright (C) 2016 The R Foundation for Statistical Computing
Platform: x86_64-pc-linux-gnu (64-bit)

R is free software and comes with ABSOLUTELY NO WARRANTY.
You are welcome to redistribute it under certain conditions.
Type 'license()' or 'licence()' for distribution details.

R is a collaborative project with many contributors.
Type 'contributors()' for more information and
'citation()' on how to cite R or R packages in publications.

Type 'demo()' for some demos, 'help()' for on-line help, or
'help.start()' for an HTML browser interface to help.
Type 'q()' to quit R.

> library(SixSigma)
> png(filename="/home/ddbj/snapshot/RGM3/R_CC/result/SixSigma/ss.pMap.Rd_%03d_medium.png", width=480, height=480)
> ### Name: ss.pMap
> ### Title: Process Map
> ### Aliases: ss.pMap
> ### Keywords: map process
>
> ### ** Examples
>
>
> inputs.overall<-c("operators", "tools", "raw material", "facilities")
> outputs.overall<-c("helicopter")
> steps<-c("INSPECTION", "ASSEMBLY", "TEST", "LABELING")
> #Inputs of process "i" are inputs of process "i+1"
> input.output<-vector(mode="list",length=length(steps))
> input.output[1]<-list(c("sheets", "..."))
> input.output[2]<-list(c("sheets"))
> input.output[3]<-list(c("helicopter"))
> input.output[4]<-list(c("helicopter"))
>
> #Parameters of each process
> x.parameters<-vector(mode="list",length=length(steps))
> x.parameters[1]<-list(c(list(c("width", "NC")),list(c("operator", "C")),
+ list(c("Measure pattern", "P")), list(c("discard", "P"))))
> x.parameters[2]<-list(c(list(c("operator", "C")),list(c("cut", "P")),
+ list(c("fix", "P")), list(c("rotor.width", "C")),list(c("rotor.length",
+ "C")), list(c("paperclip", "C")), list(c("tape", "C"))))
> x.parameters[3]<-list(c(list(c("operator", "C")),list(c("throw", "P")),
+ list(c("discard", "P")), list(c("environment", "N"))))
> x.parameters[4]<-list(c(list(c("operator", "C")),list(c("label", "P"))))
> x.parameters
[[1]]
[[1]][[1]]
[1] "width" "NC"

[[1]][[2]]
[1] "operator" "C"

[[1]][[3]]
[1] "Measure pattern" "P"

[[1]][[4]]
[1] "discard" "P"


[[2]]
[[2]][[1]]
[1] "operator" "C"

[[2]][[2]]
[1] "cut" "P"

[[2]][[3]]
[1] "fix" "P"

[[2]][[4]]
[1] "rotor.width" "C"

[[2]][[5]]
[1] "rotor.length" "C"

[[2]][[6]]
[1] "paperclip" "C"

[[2]][[7]]
[1] "tape" "C"


[[3]]
[[3]][[1]]
[1] "operator" "C"

[[3]][[2]]
[1] "throw" "P"

[[3]][[3]]
[1] "discard" "P"

[[3]][[4]]
[1] "environment" "N"


[[4]]
[[4]][[1]]
[1] "operator" "C"

[[4]][[2]]
[1] "label" "P"


>
> #Features of each process
> y.features<-vector(mode="list",length=length(steps))
> y.features[1]<-list(c(list(c("ok", "Cr"))))
> y.features[2]<-list(c(list(c("weight", "Cr"))))
> y.features[3]<-list(c(list(c("time", "Cr"))))
> y.features[4]<-list(c(list(c("label", "Cr"))))
> y.features
[[1]]
[[1]][[1]]
[1] "ok" "Cr"


[[2]]
[[2]][[1]]
[1] "weight" "Cr"


[[3]]
[[3]][[1]]
[1] "time" "Cr"


[[4]]
[[4]][[1]]
[1] "label" "Cr"


>
> ss.pMap(steps, inputs.overall, outputs.overall,
+         input.output, x.parameters, y.features,
+         sub="Paper Helicopter Project")
>
>
>
>
>
>
> dev.off()
null device
          1
>
|