Supported by Dr. Osamu Ogasawara and  . . |
|
Last data update: 2014.03.03 |
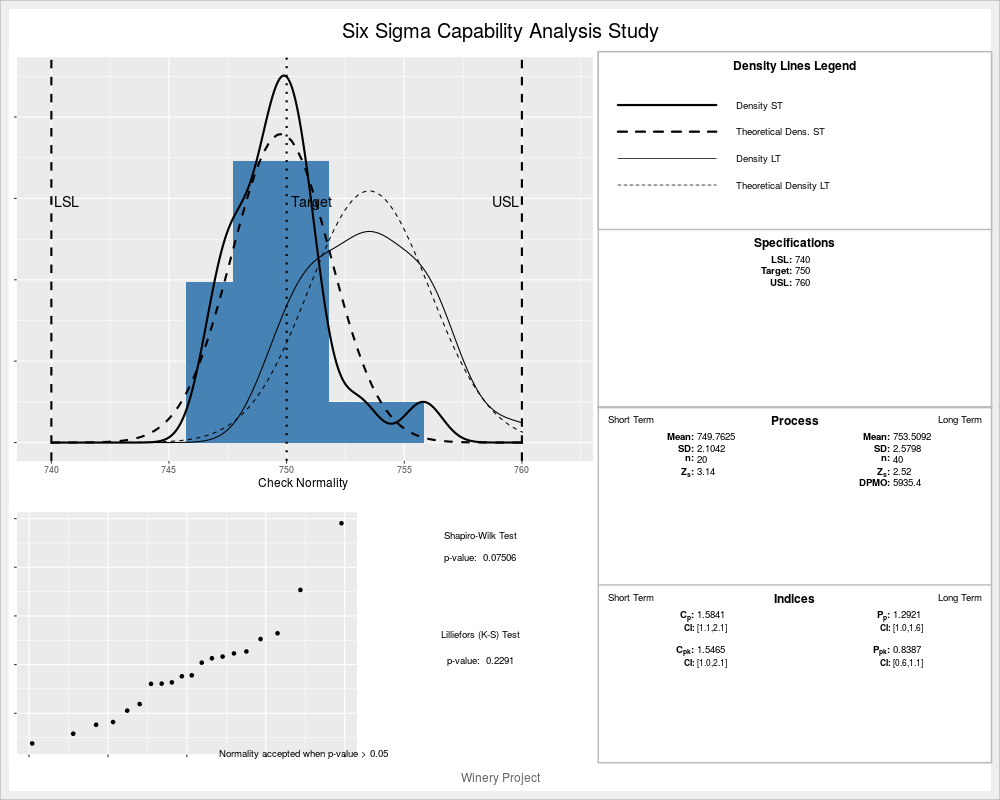
Graphs and figures for a Capability StudyDescriptionPlots a Histogram with density lines about the data of a process. Check normality with qqplot and normality tests. Shows the Specification Limits and the Capability Indices. Usagess.study.ca(xST, xLT = NA, LSL = NA, USL = NA, Target = NA, alpha = 0.05, f.na.rm = TRUE, f.main = "Six Sigma Capability Analysis Study", f.sub = "") Arguments
ValueFigures and plot for Capability Analysis Author(s)EL Cano ReferencesCano, Emilio L., Moguerza, Javier M. and Redchuk, Andres. 2012. Six Sigma with R. Statistical Engineering for Process Improvement, Use R!, vol. 36. Springer, New York. http://www.springer.com/statistics/book/978-1-4614-3651-5. Montgomery, DC (2008) Introduction to Statistical Quality Control (Sixth Edition). New York: Wiley&Sons See Also
Examplesss.study.ca(ss.data.ca$Volume, rnorm(40, 753, 3), LSL = 740, USL = 760, T = 750, alpha = 0.05, f.sub = "Winery Project") Results
R version 3.3.1 (2016-06-21) -- "Bug in Your Hair"
Copyright (C) 2016 The R Foundation for Statistical Computing
Platform: x86_64-pc-linux-gnu (64-bit)

R is free software and comes with ABSOLUTELY NO WARRANTY.
You are welcome to redistribute it under certain conditions.
Type 'license()' or 'licence()' for distribution details.

R is a collaborative project with many contributors.
Type 'contributors()' for more information and
'citation()' on how to cite R or R packages in publications.

Type 'demo()' for some demos, 'help()' for on-line help, or
'help.start()' for an HTML browser interface to help.
Type 'q()' to quit R.

> library(SixSigma)
> png(filename="/home/ddbj/snapshot/RGM3/R_CC/result/SixSigma/ss.study.ca.Rd_%03d_medium.png", width=480, height=480)
> ### Name: ss.study.ca
> ### Title: Graphs and figures for a Capability Study
> ### Aliases: ss.study.ca
>
> ### ** Examples
>
> 	ss.study.ca(ss.data.ca$Volume, rnorm(40, 753, 3),
+ 		LSL = 740, USL = 760, T = 750, alpha = 0.05,
+  			f.sub = "Winery Project")
>
>
>
>
>
> dev.off()
null device
          1
>
|