The name of the Sushi palette to return. For list of available palettes try (SushiColors(list))
Examples
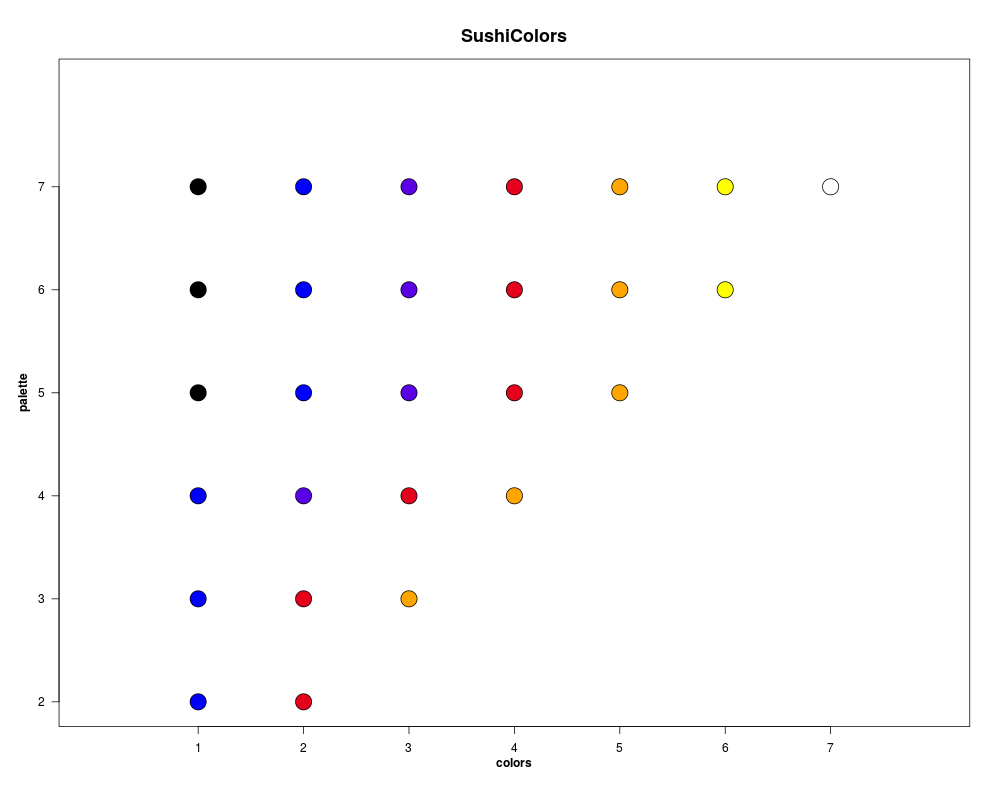
plot(1,xlab='',xaxt='n',ylab='',yaxt='n',xlim=c(0,8),ylim=c(2,8),type='n',bg="grey")
for (i in (2:7))
{
  points(x=(1:i),y=rep(i,i),bg=SushiColors(i)(i),cex=3,pch=21)

}

axis(side=2,at=(2:7),labels=(2:7),las=2)
axis(side=1,at=(1:7),labels=(1:7))
mtext("SushiColors",side=3,font=2, line=1, cex=1.5)
mtext("colors",side=1,font=2, line=2)
mtext("palette",side=2,font=2, line=2)
Results
R version 3.3.1 (2016-06-21) -- "Bug in Your Hair"
Copyright (C) 2016 The R Foundation for Statistical Computing
Platform: x86_64-pc-linux-gnu (64-bit)

R is free software and comes with ABSOLUTELY NO WARRANTY.
You are welcome to redistribute it under certain conditions.
Type 'license()' or 'licence()' for distribution details.

R is a collaborative project with many contributors.
Type 'contributors()' for more information and
'citation()' on how to cite R or R packages in publications.

Type 'demo()' for some demos, 'help()' for on-line help, or
'help.start()' for an HTML browser interface to help.
Type 'q()' to quit R.

> library(Sushi)
Loading required package: zoo

Attaching package: 'zoo'

The following objects are masked from 'package:base':

    as.Date, as.Date.numeric

Loading required package: biomaRt
> png(filename="/home/ddbj/snapshot/RGM3/R_BC/result/Sushi/SushiColors.Rd_%03d_medium.png", width=480, height=480)
> ### Name: SushiColors
> ### Title: Generates a Sushi color palette
> ### Aliases: SushiColors
>
> ### ** Examples
>
> plot(1,xlab='',xaxt='n',ylab='',yaxt='n',xlim=c(0,8),ylim=c(2,8),type='n',bg="grey")
> for (i in (2:7))
+ {
+   points(x=(1:i),y=rep(i,i),bg=SushiColors(i)(i),cex=3,pch=21)
+
+ }
>
> axis(side=2,at=(2:7),labels=(2:7),las=2)
> axis(side=1,at=(1:7),labels=(1:7))
> mtext("SushiColors",side=3,font=2, line=1, cex=1.5)
> mtext("colors",side=1,font=2, line=2)
> mtext("palette",side=2,font=2, line=2)
>
>
>
>
>
> dev.off()
null device
          1
>
 .
.