a genome object (2 columns: column 1 = chromosome name, column 2 = length of chromosome). Only for multi chromosomal plots
space
the space in between each chromosome as a fraction of the width of the plot. Only for multi chromosomal plots
scale
Scale of the plot ('bp','Kb','Mb')
side
Side of the scale to add the plot to. Only tested for sides 1 and 3.
scipen
higher values decrease the likelihood of using scientific for the position labels.
n
Desired number of ticks
chromfont
font type of chromosome label
chromadjust
position, as a fraction of the width of the plot, of the chomosome label
chromcex
font size of the chomosome label
chromline
vertical offset of the chomosome label
scalefont
font type of scale label
scaleadjust
position, as a fraction of the width of the plot, of the scale label
scalecex
font size of the scale label
scaleline
vertical offset of the scale label
line
vertical offset of position labels
edgeblankfraction
percent of the edges to leave black for chromosome and scale labels
...
values to be passed to axis
Examples
data(Sushi_DNaseI.bedgraph)
# set the genomic regions
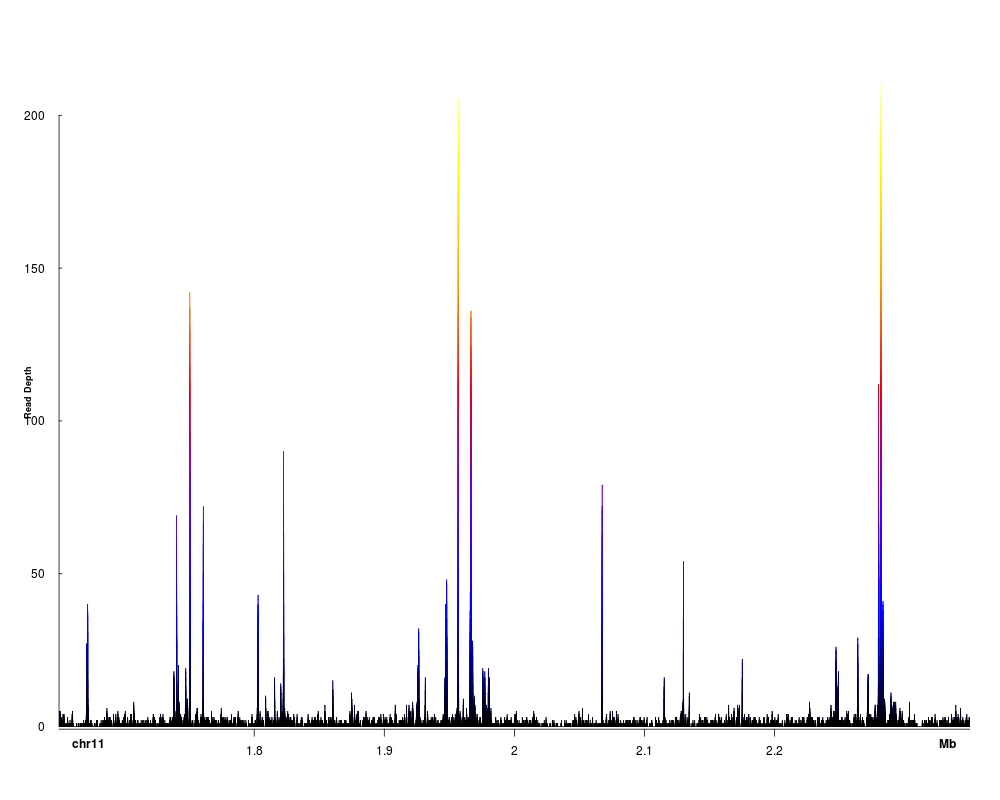
plotBedgraph(Sushi_DNaseI.bedgraph,chrom="chr11",chromstart=1650000,chromend=2350000,colorbycol=SushiColors(7))
labelgenome(chrom="chr11",chromstart=1650000,chromend=2350000,side=1,n=4,scale="Mb")
axis(side=2,las=2,tcl=.2)
mtext("Read Depth",side=2,line=1.75,cex=.75,font=2)
Results
R version 3.3.1 (2016-06-21) -- "Bug in Your Hair"
Copyright (C) 2016 The R Foundation for Statistical Computing
Platform: x86_64-pc-linux-gnu (64-bit)

R is free software and comes with ABSOLUTELY NO WARRANTY.
You are welcome to redistribute it under certain conditions.
Type 'license()' or 'licence()' for distribution details.

R is a collaborative project with many contributors.
Type 'contributors()' for more information and
'citation()' on how to cite R or R packages in publications.

Type 'demo()' for some demos, 'help()' for on-line help, or
'help.start()' for an HTML browser interface to help.
Type 'q()' to quit R.

> library(Sushi)
Loading required package: zoo

Attaching package: 'zoo'

The following objects are masked from 'package:base':

    as.Date, as.Date.numeric

Loading required package: biomaRt
> png(filename="/home/ddbj/snapshot/RGM3/R_BC/result/Sushi/labelgenome.Rd_%03d_medium.png", width=480, height=480)
> ### Name: labelgenome
> ### Title: Adds genome coordinates to the x-axis of a Sushi plot
> ### Aliases: labelgenome
>
> ### ** Examples
>
> data(Sushi_DNaseI.bedgraph)
> # set the genomic regions
>
> plotBedgraph(Sushi_DNaseI.bedgraph,chrom="chr11",chromstart=1650000,chromend=2350000,colorbycol=SushiColors(7))
> labelgenome(chrom="chr11",chromstart=1650000,chromend=2350000,side=1,n=4,scale="Mb")
> axis(side=2,las=2,tcl=.2)
> mtext("Read Depth",side=2,line=1.75,cex=.75,font=2)
>
>
>
>
>
> dev.off()
null device
          1
>
 .
.