R version 3.3.1 (2016-06-21) -- "Bug in Your Hair"
Copyright (C) 2016 The R Foundation for Statistical Computing
Platform: x86_64-pc-linux-gnu (64-bit)
R is free software and comes with ABSOLUTELY NO WARRANTY.
You are welcome to redistribute it under certain conditions.
Type 'license()' or 'licence()' for distribution details.
R is a collaborative project with many contributors.
Type 'contributors()' for more information and
'citation()' on how to cite R or R packages in publications.
Type 'demo()' for some demos, 'help()' for on-line help, or
'help.start()' for an HTML browser interface to help.
Type 'q()' to quit R.
> library(Sushi)
Loading required package: zoo
Attaching package: 'zoo'
The following objects are masked from 'package:base':
as.Date, as.Date.numeric
Loading required package: biomaRt
> png(filename="/home/ddbj/snapshot/RGM3/R_BC/result/Sushi/labelplot.Rd_%03d_medium.png", width=480, height=480)
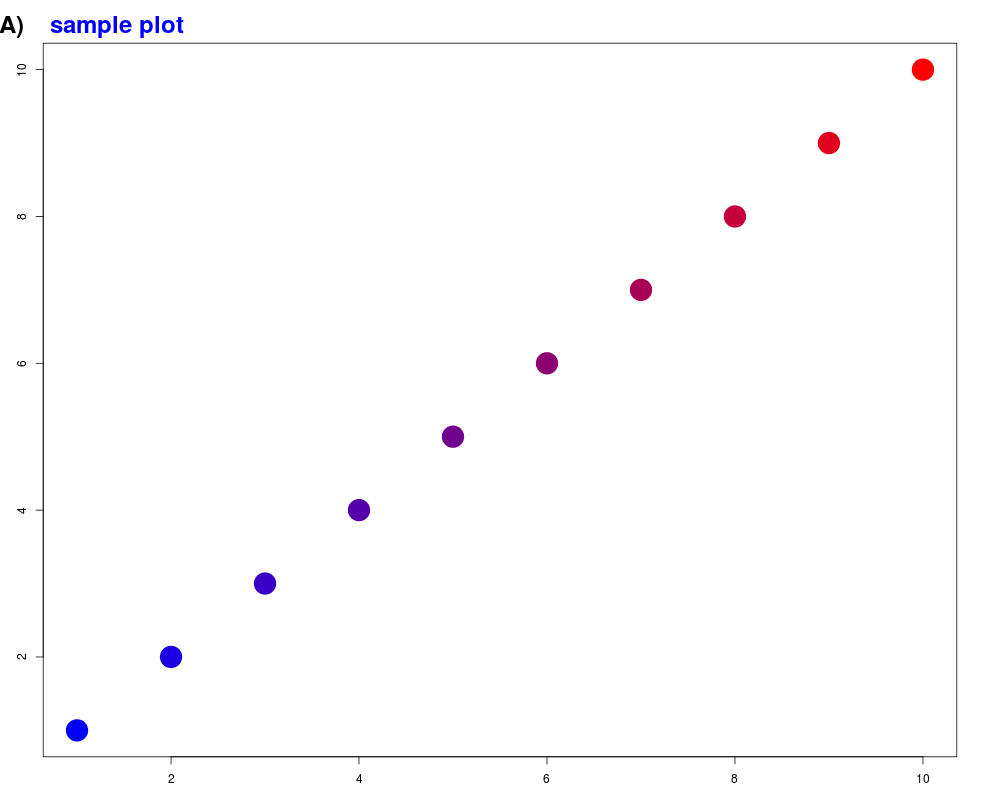
> ### Name: labelplot
> ### Title: adds a letter and a title to a plot
> ### Aliases: labelplot
>
> ### ** Examples
>
> par(mar=c(3,3,3,3))
> plot((1:10),col=maptocolors(vec=(1:10),colorRampPalette(c("blue","red"))),pch=19,cex=4)
> labelplot("A)"," sample plot",lettercex=2,titlecex=2,titlecol="blue")
>
>
>
>
>
> dev.off()
null device
1
>
 .
.