Last data update: 2014.03.03
R: plots data stored in bed file format
plots data stored in bed file format
Description
plots data stored in bed file format
Usage
plotBedpe(bedpedata, chrom, chromstart, chromend, heights, color = "black",
  colorby = NULL, colorbycol = NULL, colorbyrange = NULL, border = NULL,
  lwdby = NULL, lwdrange = c(1, 5), offset = 0, flip = FALSE, lwd = 1,
  xaxt = "n", yaxt = "n", bty = "n", plottype = "loops",
  maxrows = 10000, height = 0.3, ymax = 1.04, ...)
Arguments
bedpedata
bed paired end data to be plotted
chrom
chromosome of region to be plotted
chromstart
start position
chromend
end position
heights
single value or vector specifying the height of the arches to be plotted (only valid when plottype is set to "loops" )
color
single value or vector specifying colors of bedpe elements
colorby
vector to scale colors by
colorbycol
palette to apply color scale to (only valid when colorby is not NULL)
colorbyrange
the range of values to apply the color scale to. Values outside that range will be set to the limits of the range.
lwdby
vector to scale line widths by
lwdrange
the range of values to apply the line width scale to. Values outside that range will be set to the limits of the range.
offset
offset of bedpe elements from the x-axis
flip
TRUE/FALSE whether the plot should be flipped over the x-axis
lwd
linewidth for bedpe elements (only valid when colorby is not NULL)
xaxt
A character which specifies the x axis type. See par
yaxt
A character which specifies the y axis type. See par
bty
A character string which determined the type of box which is drawn about plots. See par
plottype
type of plot (acceptable values are 'loops', 'ribbons', or 'lines')
maxrows
The maximum number of rows to plot on the y-axis
height
the height of the boxes at either end of a bedpe element if plottype is set to 'lines'. Typical vaues range form 0 to 1. (only valid when plottype is set to 'lines')
ymax
fraction of max y value to set as height of plot. Only applies when plottype is set to 'loops' or 'ribbons'
...
values to be passed to plot
Examples
data(Sushi_5C.bedpe)
chrom = "chr11"
chromstart = 1650000
chromend = 2350000
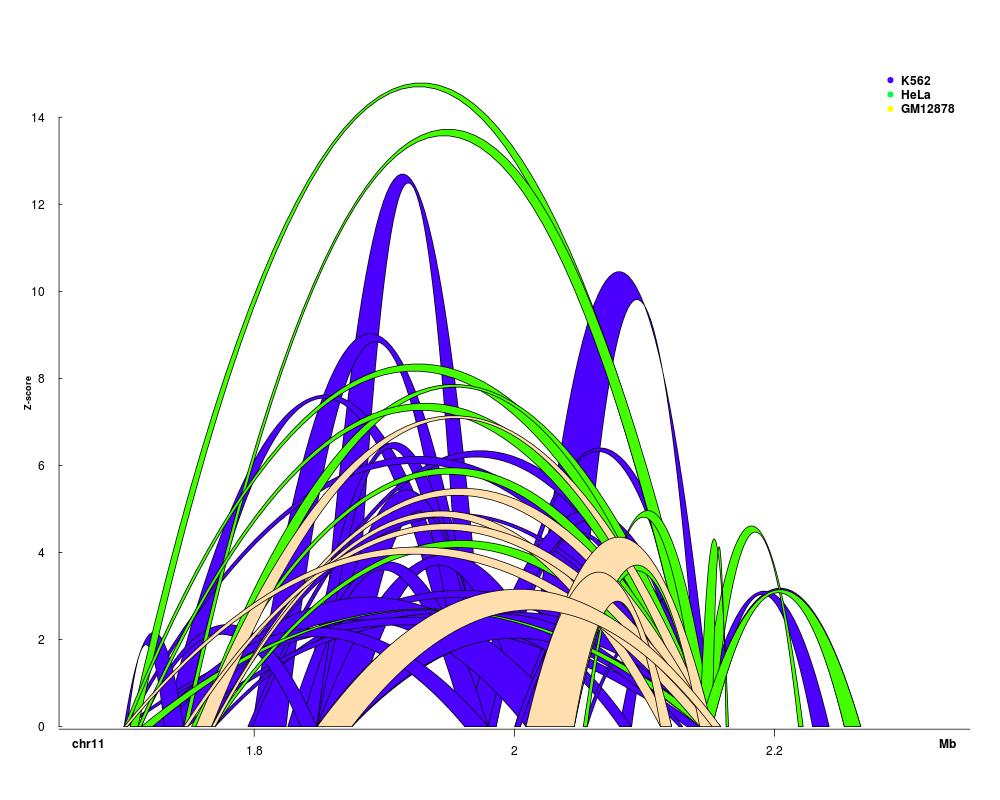
pbpe = plotBedpe(Sushi_5C.bedpe,chrom,chromstart,chromend,heights = Sushi_5C.bedpe$score,offset=0,flip=FALSE,bty='n',
lwd=1,plottype="ribbons",colorby=Sushi_5C.bedpe$samplenumber,colorbycol=topo.colors,border="black")
labelgenome(chrom, chromstart,chromend,side=1,scipen=20,n=3,scale="Mb",line=.18,chromline=.5,scaleline=0.5)
legend("topright",inset =0.01,legend=c("K562","HeLa","GM12878"),col=c(topo.colors(3)),pch=19,bty='n',text.font=2)
axis(side=2,las=2,tcl=.2)
mtext("Z-score",side=2,line=1.75,cex=.75,font=2)
Results
R version 3.3.1 (2016-06-21) -- "Bug in Your Hair"
Copyright (C) 2016 The R Foundation for Statistical Computing
Platform: x86_64-pc-linux-gnu (64-bit)

R is free software and comes with ABSOLUTELY NO WARRANTY.
You are welcome to redistribute it under certain conditions.
Type 'license()' or 'licence()' for distribution details.

R is a collaborative project with many contributors.
Type 'contributors()' for more information and
'citation()' on how to cite R or R packages in publications.

Type 'demo()' for some demos, 'help()' for on-line help, or
'help.start()' for an HTML browser interface to help.
Type 'q()' to quit R.

> library(Sushi)
Loading required package: zoo

Attaching package: 'zoo'

The following objects are masked from 'package:base':

    as.Date, as.Date.numeric

Loading required package: biomaRt
> png(filename="/home/ddbj/snapshot/RGM3/R_BC/result/Sushi/plotBedpe.Rd_%03d_medium.png", width=480, height=480)
> ### Name: plotBedpe
> ### Title: plots data stored in bed file format
> ### Aliases: plotBedpe
>
> ### ** Examples
>
> data(Sushi_5C.bedpe)
>
> chrom            = "chr11"
> chromstart       = 1650000
> chromend         = 2350000
> pbpe = plotBedpe(Sushi_5C.bedpe,chrom,chromstart,chromend,heights = Sushi_5C.bedpe$score,offset=0,flip=FALSE,bty='n',
+ lwd=1,plottype="ribbons",colorby=Sushi_5C.bedpe$samplenumber,colorbycol=topo.colors,border="black")
[1] 0.01467833
[1] 0.1027483
[1] ""
[1] 0.04582833
[1] 0.3207983
[1] ""
[1] 0.01322167
[1] 0.09255167
[1] ""
[1] 0.00528
[1] 0.03696
[1] ""
[1] 0.009596667
[1] 0.06717667
[1] ""
[1] 0.005646667
[1] 0.03952667
[1] ""
[1] 0.01035167
[1] 0.07246167
[1] ""
[1] 0.011745
[1] 0.082215
[1] ""
[1] 0.03432
[1] 0.24024
[1] ""
[1] 0.004385
[1] 0.030695
[1] ""
[1] 0.013995
[1] 0.097965
[1] ""
[1] 0.003825
[1] 0.026775
[1] ""
[1] 0.017155
[1] 0.120085
[1] ""
[1] 0.008725
[1] 0.061075
[1] ""
[1] 0.01321667
[1] 0.09251667
[1] ""
[1] 0.005021667
[1] 0.03515167
[1] ""
[1] 0.005393333
[1] 0.03775333
[1] ""
[1] 0.01155
[1] 0.08085
[1] ""
[1] 0.0005683333
[1] 0.003978333
[1] ""
[1] 0.03711333
[1] 0.2597933
[1] ""
[1] 0.006903333
[1] 0.04832333
[1] ""
[1] 0.01066833
[1] 0.07467833
[1] ""
[1] 0.01247333
[1] 0.08731333
[1] ""
[1] 0.02924167
[1] 0.2046917
[1] ""
[1] 0.03377333
[1] 0.2364133
[1] ""
[1] 0.03973
[1] 0.27811
[1] ""
[1] 0.016045
[1] 0.112315
[1] ""
[1] 0.01473
[1] 0.10311
[1] ""
[1] 0.01093
[1] 0.07651
[1] ""
[1] 0.02046
[1] 0.14322
[1] ""
[1] 0.006243333
[1] 0.04370333
[1] ""
[1] 0.01066833
[1] 0.07467833
[1] ""
[1] 0.011745
[1] 0.082215
[1] ""
[1] 0.004385
[1] 0.030695
[1] ""
[1] 0.01164667
[1] 0.08152667
[1] ""
[1] 0.01054167
[1] 0.07379167
[1] ""
[1] 0.01093
[1] 0.07651
[1] ""
[1] 0.009976667
[1] 0.06983667
[1] ""
[1] 0.01279667
[1] 0.08957667
[1] ""
[1] 0.01155
[1] 0.08085
[1] ""
[1] 0.04582833
[1] 0.3207983
[1] ""
[1] 0.005021667
[1] 0.03515167
[1] ""
[1] 0.001553333
[1] 0.01087333
[1] ""
[1] 0.004385
[1] 0.030695
[1] ""
[1] 0.01155
[1] 0.08085
[1] ""
[1] 0.009728333
[1] 0.06809833
[1] ""
[1] 0.01066833
[1] 0.07467833
[1] ""
[1] 0.011745
[1] 0.082215
[1] ""
[1] 0.04582833
[1] 0.3207983
[1] ""
[1] 0.04765
[1] 0.33355
[1] ""
[1] 0.03377333
[1] 0.2364133
[1] ""
There were 50 or more warnings (use warnings() to see the first 50)
> labelgenome(chrom, chromstart,chromend,side=1,scipen=20,n=3,scale="Mb",line=.18,chromline=.5,scaleline=0.5)
> legend("topright",inset =0.01,legend=c("K562","HeLa","GM12878"),col=c(topo.colors(3)),pch=19,bty='n',text.font=2)
> axis(side=2,las=2,tcl=.2)
> mtext("Z-score",side=2,line=1.75,cex=.75,font=2)
>
>
>
>
>
> dev.off()
null device
          1
>
 .
.