gene info stored in a bed-like format. If NULL it will look up genes in the region using biomart (with biomart="ensembl" and dataset="hsapiens_gene_ensembl"). See also useMart
chrom
chromosome of region to be plotted
chromstart
start position
chromend
end position
col
single value or vector specifying colors of gene structures
bheight
the height of the boxes drawn for exons
lheight
the height of the bent line is bent is set to TRUE
bentline
TRUE/FALSE indicating whether lines between exons should be bent
packrow
TRUE / FALSE indicating whether genes should be packed or whether each gene should be plotted on its own row
maxrows
The maximum number of rows to plot on the y-axis
colorby
vector to scale colors by
colorbyrange
the range of values to apply the color scale to. Values outside that range will be set to the limits of the range.
colorbycol
palette to apply color scale to (only valid when colorby is not NULL)
types
single value or vector specifying types of elements (acceptable values are 'exon','utr')
plotgenetype
String specifying whether the genes should resemble a 'box' or a 'arrow'
arrowlength
value (between 0 and 1) specifying the length of the tail of each arrow as a fraction of the total plot width (only valid when plotgenetype is set to "arrow")
wigglefactor
the fraction of the plot to leave blank on either side of each element to avoid overcrowding.
labeltext
TRUE/FALSE indicating whether genes should be labeled
labeloffset
value (between 0 and 1) specifying the vertical offset of gene labels
fontsize
font size of gene labels
fonttype
font type of gene labels
labelat
postion along gene to place labels (acceptable values are "middle","start",and "end")
R version 3.3.1 (2016-06-21) -- "Bug in Your Hair"
Copyright (C) 2016 The R Foundation for Statistical Computing
Platform: x86_64-pc-linux-gnu (64-bit)
R is free software and comes with ABSOLUTELY NO WARRANTY.
You are welcome to redistribute it under certain conditions.
Type 'license()' or 'licence()' for distribution details.
R is a collaborative project with many contributors.
Type 'contributors()' for more information and
'citation()' on how to cite R or R packages in publications.
Type 'demo()' for some demos, 'help()' for on-line help, or
'help.start()' for an HTML browser interface to help.
Type 'q()' to quit R.
> library(Sushi)
Loading required package: zoo
Attaching package: 'zoo'
The following objects are masked from 'package:base':
as.Date, as.Date.numeric
Loading required package: biomaRt
> png(filename="/home/ddbj/snapshot/RGM3/R_BC/result/Sushi/plotGenes.Rd_%03d_medium.png", width=480, height=480)
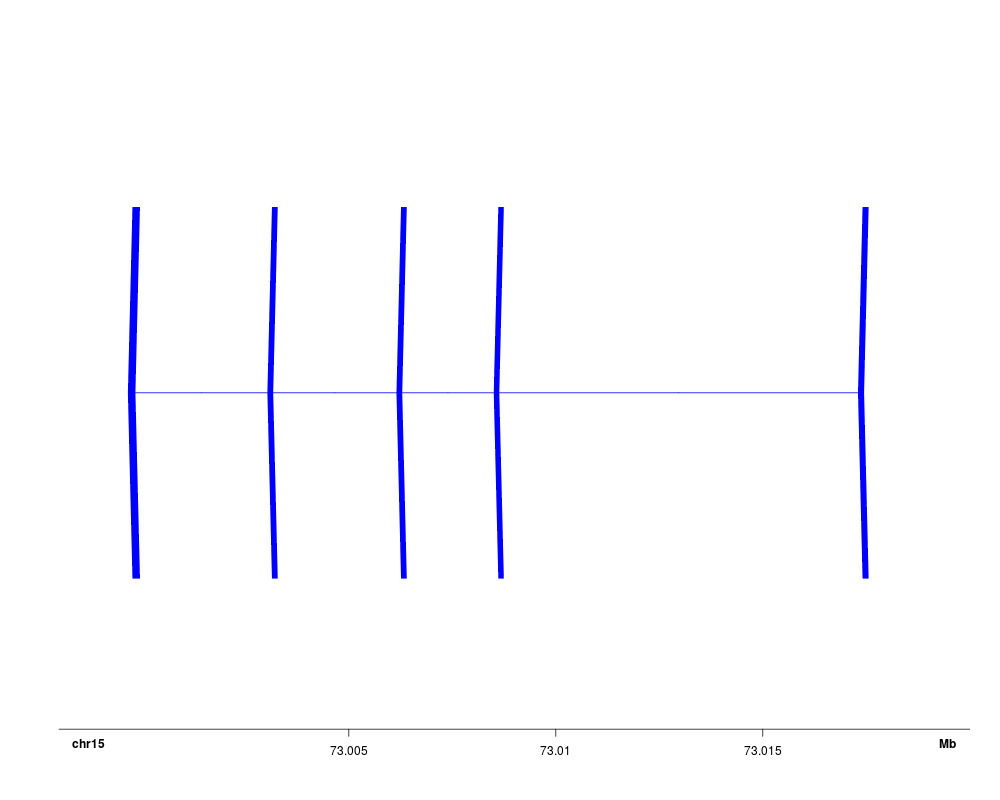
> ### Name: plotGenes
> ### Title: plots gene structure or transcript structures
> ### Aliases: plotGenes
>
> ### ** Examples
>
> data(Sushi_genes.bed)
>
> chrom = "chr15"
> chromstart = 72998000
> chromend = 73020000
> chrom_biomart = 15
>
> plotGenes(Sushi_genes.bed,chrom_biomart,chromstart,chromend ,types=Sushi_genes.bed$type,
+ maxrows=1,height=0.5,plotgenetype="arrow",bentline=FALSE,col="blue",
+ labeloffset=1,fontsize=1.2)
[[1]]
NULL
[[2]]
function (n)
{
x <- ramp(seq.int(0, 1, length.out = n))
if (ncol(x) == 4L)
rgb(x[, 1L], x[, 2L], x[, 3L], x[, 4L], maxColorValue = 255)
else rgb(x[, 1L], x[, 2L], x[, 3L], maxColorValue = 255)
}
<bytecode: 0x82b7fc0>
<environment: 0x82b8e28>
>
> labelgenome( chrom, chromstart,chromend,side=1,scipen=20,n=3,scale="Mb",line=.18,chromline=.5,scaleline=0.5)
>
>
>
>
>
> dev.off()
null device
1
>
 .
.