Supported by Dr. Osamu Ogasawara and  . . |
|
Last data update: 2014.03.03 |
Function to do mlr normalization for a matrix groupDescriptionDo mlr normalization separately for each set of replicates first, then normalize the resulting matrix UsagemlrGroup(mat, Group) Arguments
ValueResulting normalized matrix of the same size as the initial one References*Find reference to mlr paper* See Also
Examples
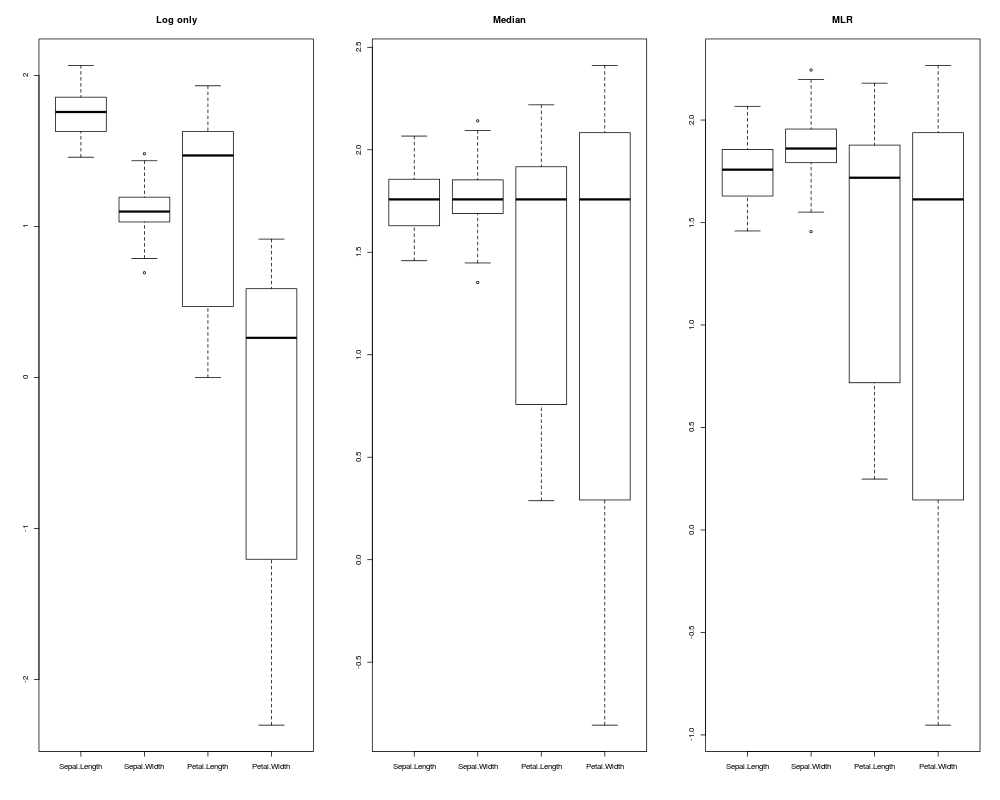
res = mlrGroup(iris[,-5], Group=as.factor(c("Sepal", "Sepal", "Petal", "Petal")))

layout(matrix(1:3, nrow=1))
boxplot(log(iris[,-5]), main="Log only")
boxplot(log(medianNorm(iris[,-5])), main="Median")
boxplot(log(res[[1]]), main="MLR")
Results
R version 3.3.1 (2016-06-21) -- "Bug in Your Hair"
Copyright (C) 2016 The R Foundation for Statistical Computing
Platform: x86_64-pc-linux-gnu (64-bit)

R is free software and comes with ABSOLUTELY NO WARRANTY.
You are welcome to redistribute it under certain conditions.
Type 'license()' or 'licence()' for distribution details.

R is a collaborative project with many contributors.
Type 'contributors()' for more information and
'citation()' on how to cite R or R packages in publications.

Type 'demo()' for some demos, 'help()' for on-line help, or
'help.start()' for an HTML browser interface to help.
Type 'q()' to quit R.

> library(SwathXtend)
Loading required package: e1071
Loading required package: openxlsx
Loading required package: VennDiagram
Loading required package: grid
Loading required package: futile.logger
Loading required package: lattice
> png(filename="/home/ddbj/snapshot/RGM3/R_BC/result/SwathXtend/mlrGroup.Rd_%03d_medium.png", width=480, height=480)
> ### Name: mlrGroup
> ### Title: Function to do mlr normalization for a matrix group
> ### Aliases: mlrGroup
>
> ### ** Examples
>
>
> res = mlrGroup(iris[,-5], Group=as.factor(c("Sepal", "Sepal", "Petal", "Petal")))
>
> layout(matrix(1:3, nrow=1))
> boxplot(log(iris[,-5]), main="Log only")
> boxplot(log(medianNorm(iris[,-5])), main="Median")
> boxplot(log(res[[1]]), main="MLR")
>
>
>
>
>
>
>
> dev.off()
null device
          1
>
|
Created & Maintained by Osamu Ogasawara (osamu.ogasawara@gmail.com) and 