Supported by Dr. Osamu Ogasawara and  . . |
|
Last data update: 2014.03.03 |
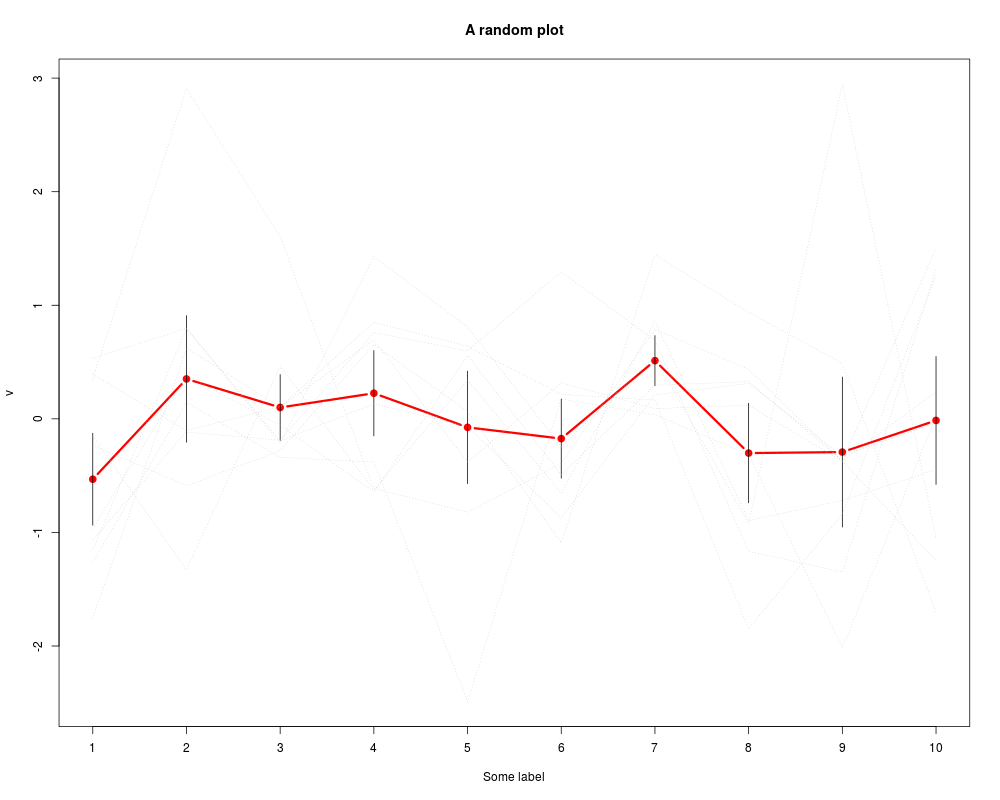
Utility for clustering plots to plot lines and an overall trendDescriptionPrints faint lines for each profile, and a mean/error bars UsageplotErrorBarsLines(v, barSizes, lines, labels = NULL, col = "blue", ylim, ...) Arguments
ValueNo returned value; plot only. See Also
Examplesmat = matrix(rnorm(100), 10) plotErrorBarsLines(apply(mat,1,FUN=mean), apply(mat,1,FUN=sd), lines=mat, col="red", main="A random plot", xlab="Some label") Results
R version 3.3.1 (2016-06-21) -- "Bug in Your Hair"
Copyright (C) 2016 The R Foundation for Statistical Computing
Platform: x86_64-pc-linux-gnu (64-bit)

R is free software and comes with ABSOLUTELY NO WARRANTY.
You are welcome to redistribute it under certain conditions.
Type 'license()' or 'licence()' for distribution details.

R is a collaborative project with many contributors.
Type 'contributors()' for more information and
'citation()' on how to cite R or R packages in publications.

Type 'demo()' for some demos, 'help()' for on-line help, or
'help.start()' for an HTML browser interface to help.
Type 'q()' to quit R.

> library(SwathXtend)
Loading required package: e1071
Loading required package: openxlsx
Loading required package: VennDiagram
Loading required package: grid
Loading required package: futile.logger
Loading required package: lattice
> png(filename="/home/ddbj/snapshot/RGM3/R_BC/result/SwathXtend/plotErrorBarsLines.Rd_%03d_medium.png", width=480, height=480)
> ### Name: plotErrorBarsLines
> ### Title: Utility for clustering plots to plot lines and an overall trend
> ### Aliases: plotErrorBarsLines
> ### Keywords: ~kwd1 ~kwd2
>
> ### ** Examples
>
> mat = matrix(rnorm(100), 10)
> plotErrorBarsLines(apply(mat,1,FUN=mean), apply(mat,1,FUN=sd),
+ 	lines=mat, col="red", main="A random plot", xlab="Some label")
>
>
>
>
>
>
>
> dev.off()
null device
          1
>
|
Created & Maintained by Osamu Ogasawara (osamu.ogasawara@gmail.com) and 