numeric matrix or data frame containing expression data
(count data or microarray data), where each row indicates the
gene (or transcript or probeset ID), each column indicates the
sample (or library), and each cell indicates the expression value
(i.e., number of counts or signal intensity) of the gene in the
sample.
dist.method
character string specifying a type for correlation
coefficient ("spearman" or "pearson") used as
distance. The default is "spearman". The hierarchical
clustering is performed using the distance
(i.e., 1 - "spearman" correlation coefficient, by default).
hclust.method
character string specifying an agglomeration method
used in hclust function: "ward",
"single", "complete", "average",
"mcquitty", "median" or "centroid".
The default is "average".
unique.pattern
logical. If FALSE, the input expression
data are directly applied for clustering. If TRUE (default),
the input data only having unique expression patterns are applied.)
Value
An object of class hclust which describes the tree
produced by the clustering process. See hclust for
details.
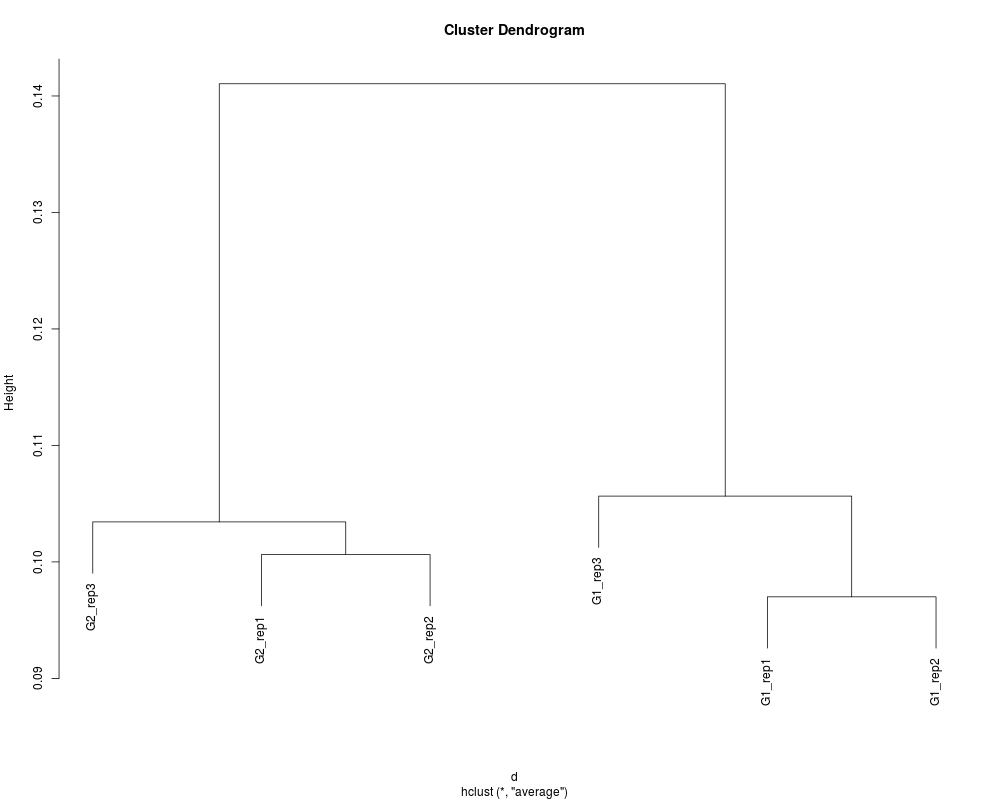
Examples
# Perform sample clustering with default options.
data(hypoData)
hc <- clusterSample(hypoData)
plot(hc)

# Obtain the same result using the 'unique.pattern = FALSE' option.
data(hypoData)
keep <- as.logical(rowSums(hypoData) > 0)
data <- unique(hypoData[keep, ])
hc <- clusterSample(data, unique.pattern = FALSE)
plot(hc)
Results
R version 3.3.1 (2016-06-21) -- "Bug in Your Hair"
Copyright (C) 2016 The R Foundation for Statistical Computing
Platform: x86_64-pc-linux-gnu (64-bit)

R is free software and comes with ABSOLUTELY NO WARRANTY.
You are welcome to redistribute it under certain conditions.
Type 'license()' or 'licence()' for distribution details.

R is a collaborative project with many contributors.
Type 'contributors()' for more information and
'citation()' on how to cite R or R packages in publications.

Type 'demo()' for some demos, 'help()' for on-line help, or
'help.start()' for an HTML browser interface to help.
Type 'q()' to quit R.

> library(TCC)
Loading required package: DESeq
Loading required package: BiocGenerics
Loading required package: parallel

Attaching package: 'BiocGenerics'

The following objects are masked from 'package:parallel':

    clusterApply, clusterApplyLB, clusterCall, clusterEvalQ,
    clusterExport, clusterMap, parApply, parCapply, parLapply,
    parLapplyLB, parRapply, parSapply, parSapplyLB

The following objects are masked from 'package:stats':

    IQR, mad, xtabs

The following objects are masked from 'package:base':

    Filter, Find, Map, Position, Reduce, anyDuplicated, append,
    as.data.frame, cbind, colnames, do.call, duplicated, eval, evalq,
    get, grep, grepl, intersect, is.unsorted, lapply, lengths, mapply,
    match, mget, order, paste, pmax, pmax.int, pmin, pmin.int, rank,
    rbind, rownames, sapply, setdiff, sort, table, tapply, union,
    unique, unsplit

Loading required package: Biobase
Welcome to Bioconductor

    Vignettes contain introductory material; view with
    'browseVignettes()'. To cite Bioconductor, see
    'citation("Biobase")', and for packages 'citation("pkgname")'.

Loading required package: locfit
locfit 1.5-9.1 	 2013-03-22
Loading required package: lattice
    Welcome to 'DESeq'. For improved performance, usability and
    functionality, please consider migrating to 'DESeq2'.
Loading required package: DESeq2
Loading required package: S4Vectors
Loading required package: stats4

Attaching package: 'S4Vectors'

The following objects are masked from 'package:base':

    colMeans, colSums, expand.grid, rowMeans, rowSums

Loading required package: IRanges
Loading required package: GenomicRanges
Loading required package: GenomeInfoDb
Loading required package: SummarizedExperiment

Attaching package: 'DESeq2'

The following objects are masked from 'package:DESeq':

    estimateSizeFactorsForMatrix, getVarianceStabilizedData,
    varianceStabilizingTransformation

Loading required package: edgeR
Loading required package: limma

Attaching package: 'limma'

The following object is masked from 'package:DESeq2':

    plotMA

The following object is masked from 'package:DESeq':

    plotMA

The following object is masked from 'package:BiocGenerics':

    plotMA

Loading required package: baySeq
Loading required package: abind
Loading required package: perm
Loading required package: ROC

Attaching package: 'TCC'

The following object is masked from 'package:edgeR':

    calcNormFactors

> png(filename="/home/ddbj/snapshot/RGM3/R_BC/result/TCC/clusterSample.Rd_%03d_medium.png", width=480, height=480)
> ### Name: clusterSample
> ### Title: Perform hierarchical clustering for samples from expression data
> ### Aliases: clusterSample
>
> ### ** Examples
>
> # Perform sample clustering with default options.
> data(hypoData)
> hc <- clusterSample(hypoData)
> plot(hc)
>
> # Obtain the same result using the 'unique.pattern = FALSE' option.
> data(hypoData)
> keep <- as.logical(rowSums(hypoData) > 0)
> data <- unique(hypoData[keep, ])
> hc <- clusterSample(data, unique.pattern = FALSE)
> plot(hc)
>
>
>
>
>
> dev.off()
null device
          1
>
 .
.