This function creates a pseudo-color image of simulation data
regarding the number of differentially expressed genes (DEGs)
and the breakdowns for individual groups from a TCC-class object.
Usage
plotFCPseudocolor(tcc, main, xlab, ylab)
Arguments
tcc
TCC-class object.
main
character string indicating the plotting title.
xlab
character string indicating the x-label title.
ylab
character string indicating the y-label title.
Details
This function should be used after the
simulateReadCounts function that generates
simulation data with arbitrary defined conditions.
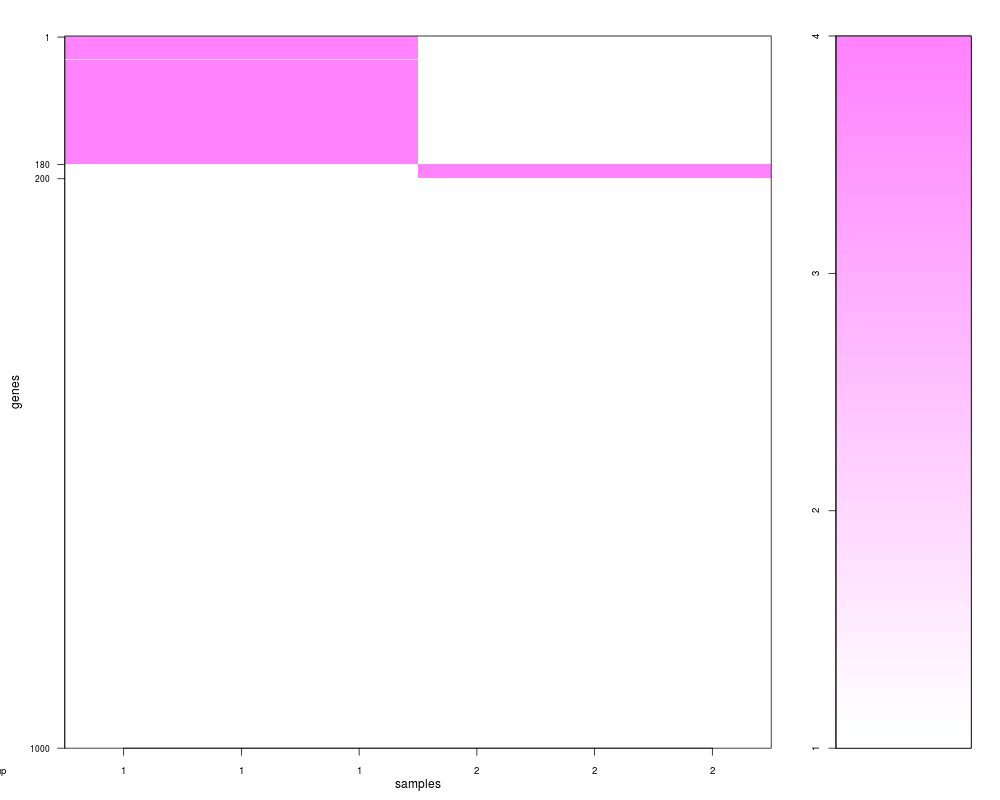
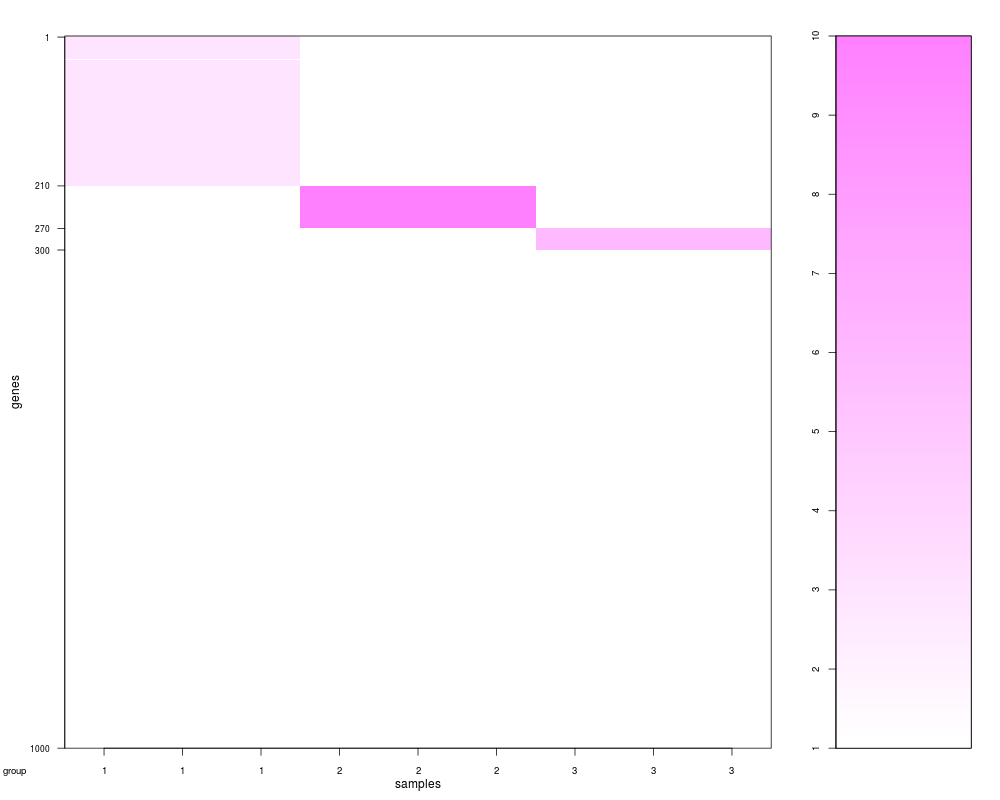
The largest log fold-change (FC) values are
in magenta and no-changes are in white.
Examples
# Generating a simulation data for comparing two groups
# (G1 vs. G2) with biological replicates.
# the first 200 genes are DEGs, where 180 are up in G1.
tcc <- simulateReadCounts(Ngene = 1000, PDEG = 0.2,
                          DEG.assign = c(0.9, 0.1),
                          DEG.foldchange = c(4, 4),
                          replicates = c(3, 3))
plotFCPseudocolor(tcc)

# Generating a simulation data for comparing three groups
# (G1 vs. G2 vs. G3) with biological replicates.
# the first 300 genes are DEGs, where the 70%, 20%, and 10% are
# up-regulated in G1, G2, G3, respectively. The levels of DE are
# 3-, 10, and 6-fold in individual groups.
tcc <- simulateReadCounts(Ngene = 1000, PDEG = 0.3,
                          DEG.assign = c(0.7, 0.2, 0.1),
                          DEG.foldchange = c(3, 10, 6),
                          replicates = c(3, 3, 3))
plotFCPseudocolor(tcc)
Results
R version 3.3.1 (2016-06-21) -- "Bug in Your Hair"
Copyright (C) 2016 The R Foundation for Statistical Computing
Platform: x86_64-pc-linux-gnu (64-bit)

R is free software and comes with ABSOLUTELY NO WARRANTY.
You are welcome to redistribute it under certain conditions.
Type 'license()' or 'licence()' for distribution details.

R is a collaborative project with many contributors.
Type 'contributors()' for more information and
'citation()' on how to cite R or R packages in publications.

Type 'demo()' for some demos, 'help()' for on-line help, or
'help.start()' for an HTML browser interface to help.
Type 'q()' to quit R.

> library(TCC)
Loading required package: DESeq
Loading required package: BiocGenerics
Loading required package: parallel

Attaching package: 'BiocGenerics'

The following objects are masked from 'package:parallel':

    clusterApply, clusterApplyLB, clusterCall, clusterEvalQ,
    clusterExport, clusterMap, parApply, parCapply, parLapply,
    parLapplyLB, parRapply, parSapply, parSapplyLB

The following objects are masked from 'package:stats':

    IQR, mad, xtabs

The following objects are masked from 'package:base':

    Filter, Find, Map, Position, Reduce, anyDuplicated, append,
    as.data.frame, cbind, colnames, do.call, duplicated, eval, evalq,
    get, grep, grepl, intersect, is.unsorted, lapply, lengths, mapply,
    match, mget, order, paste, pmax, pmax.int, pmin, pmin.int, rank,
    rbind, rownames, sapply, setdiff, sort, table, tapply, union,
    unique, unsplit

Loading required package: Biobase
Welcome to Bioconductor

    Vignettes contain introductory material; view with
    'browseVignettes()'. To cite Bioconductor, see
    'citation("Biobase")', and for packages 'citation("pkgname")'.

Loading required package: locfit
locfit 1.5-9.1 	 2013-03-22
Loading required package: lattice
    Welcome to 'DESeq'. For improved performance, usability and
    functionality, please consider migrating to 'DESeq2'.
Loading required package: DESeq2
Loading required package: S4Vectors
Loading required package: stats4

Attaching package: 'S4Vectors'

The following objects are masked from 'package:base':

    colMeans, colSums, expand.grid, rowMeans, rowSums

Loading required package: IRanges
Loading required package: GenomicRanges
Loading required package: GenomeInfoDb
Loading required package: SummarizedExperiment

Attaching package: 'DESeq2'

The following objects are masked from 'package:DESeq':

    estimateSizeFactorsForMatrix, getVarianceStabilizedData,
    varianceStabilizingTransformation

Loading required package: edgeR
Loading required package: limma

Attaching package: 'limma'

The following object is masked from 'package:DESeq2':

    plotMA

The following object is masked from 'package:DESeq':

    plotMA

The following object is masked from 'package:BiocGenerics':

    plotMA

Loading required package: baySeq
Loading required package: abind
Loading required package: perm
Loading required package: ROC

Attaching package: 'TCC'

The following object is masked from 'package:edgeR':

    calcNormFactors

> png(filename="/home/ddbj/snapshot/RGM3/R_BC/result/TCC/plotFCPseudocolor.Rd_%03d_medium.png", width=480, height=480)
> ### Name: plotFCPseudocolor
> ### Title: Create a pseudo-color image of simulation data
> ### Aliases: plotFCPseudocolor
> ### Keywords: methods
>
> ### ** Examples
>
> # Generating a simulation data for comparing two groups
> # (G1 vs. G2) with biological replicates.
> # the first 200 genes are DEGs, where 180 are up in G1.
> tcc <- simulateReadCounts(Ngene = 1000, PDEG = 0.2,
+                           DEG.assign = c(0.9, 0.1),
+                           DEG.foldchange = c(4, 4),
+                           replicates = c(3, 3))
TCC::INFO: Generating simulation data under NB distribution ...
TCC::INFO: (genesizes   :  1000 )
TCC::INFO: (replicates  :  3, 3 )
TCC::INFO: (PDEG        :  0.18, 0.02 )
> plotFCPseudocolor(tcc)
>
> # Generating a simulation data for comparing three groups
> # (G1 vs. G2 vs. G3) with biological replicates.
> # the first 300 genes are DEGs, where the 70%, 20%, and 10% are
> # up-regulated in G1, G2, G3, respectively. The levels of DE are
> # 3-, 10, and 6-fold in individual groups.
> tcc <- simulateReadCounts(Ngene = 1000, PDEG = 0.3,
+                           DEG.assign = c(0.7, 0.2, 0.1),
+                           DEG.foldchange = c(3, 10, 6),
+                           replicates = c(3, 3, 3))
TCC::INFO: Generating simulation data under NB distribution ...
TCC::INFO: (genesizes   :  1000 )
TCC::INFO: (replicates  :  3, 3, 3 )
TCC::INFO: (PDEG        :  0.21, 0.06, 0.03 )
> plotFCPseudocolor(tcc)
>
>
>
>
>
> dev.off()
null device
          1
>
 .
.