main title. If not specified it will be
"Volcano plot (group1 vs group2)
legend
Legend title
label
vector of labels to be used in the figure.
Example: c("Not Significant","Hypermethylated in group1",
"Hypomethylated in group1"))#'
xlim
x limits to cut image
ylim
y limits to cut image
color
vector of colors to be used in graph
names
Names to be ploted if significant.
Should be the same size of x and y
names.fill
Names should be filled in a color box? Default: TRUE
show.names
What names will be showd? Possibilities: "both", "significant", "highlighted"
x.cut
x-axis threshold. Default: 0.0
y.cut
p-values threshold. Default: 0.01
height
Figure height
width
Figure width
highlight
List of genes/probes to be highlighted. It should be in the names argument.
highlight.color
Color of the points highlighted
names.size
Size of the names text
dpi
Figure dpi
Details
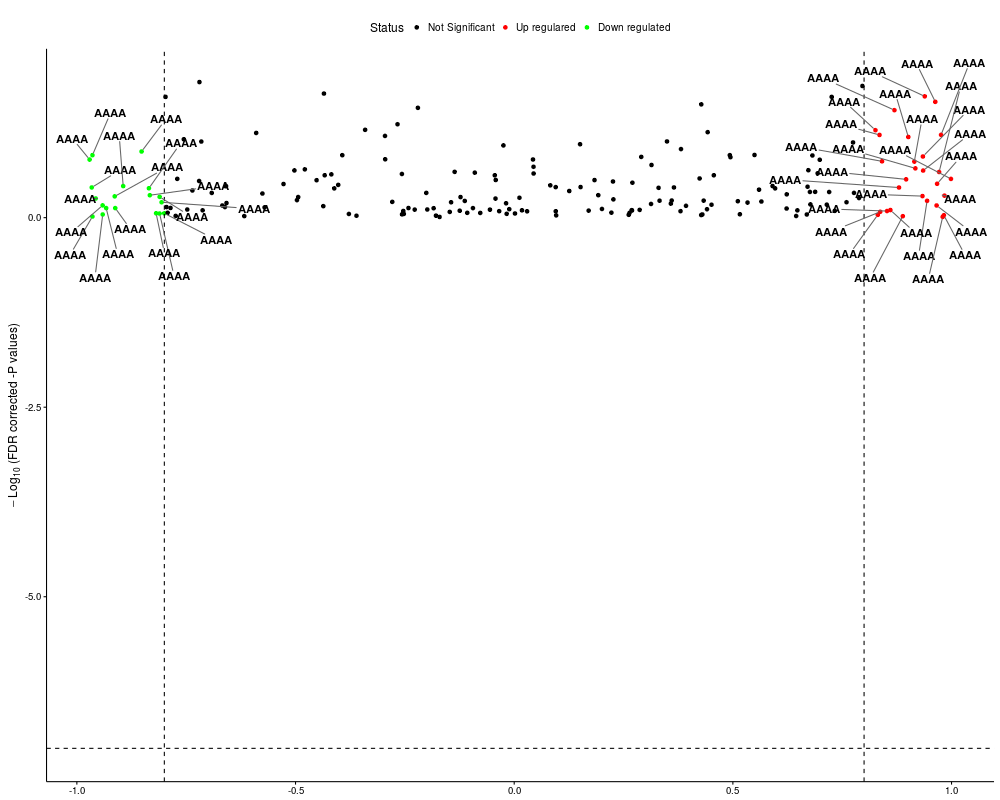
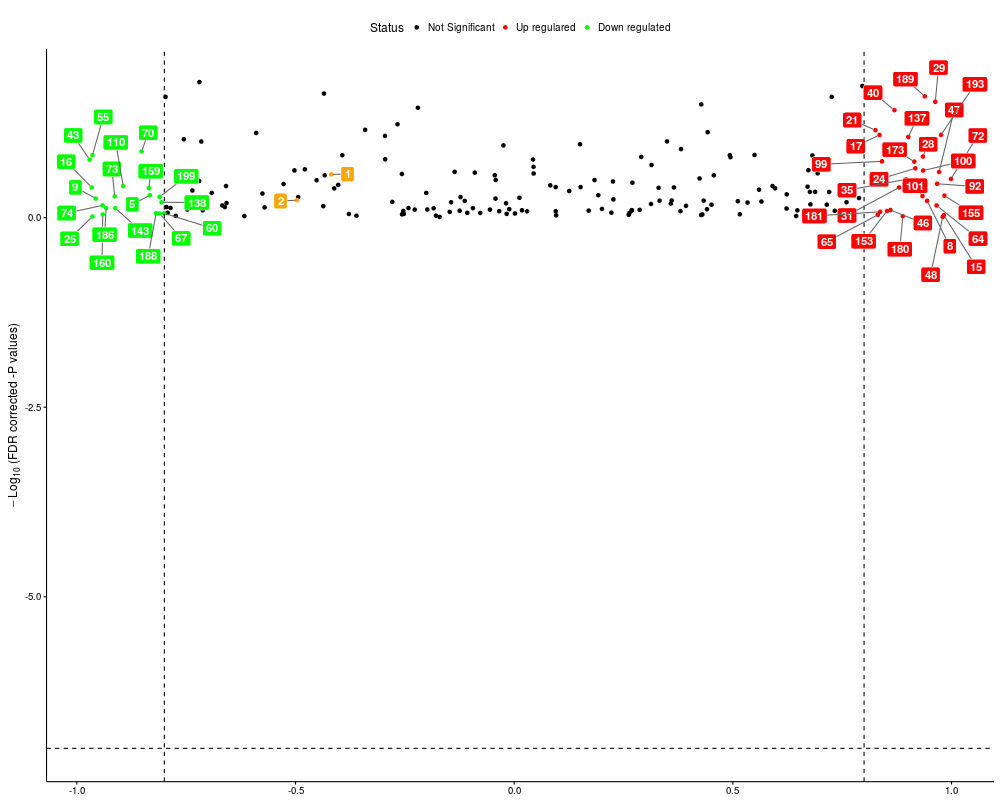
Creates a volcano plot from the expression and methylation analysis.
Please see the vignette for more information
Observation: This function automatically is called by TCGAanalyse_DMR
R version 3.3.1 (2016-06-21) -- "Bug in Your Hair"
Copyright (C) 2016 The R Foundation for Statistical Computing
Platform: x86_64-pc-linux-gnu (64-bit)

R is free software and comes with ABSOLUTELY NO WARRANTY.
You are welcome to redistribute it under certain conditions.
Type 'license()' or 'licence()' for distribution details.

R is a collaborative project with many contributors.
Type 'contributors()' for more information and
'citation()' on how to cite R or R packages in publications.

Type 'demo()' for some demos, 'help()' for on-line help, or
'help.start()' for an HTML browser interface to help.
Type 'q()' to quit R.

> library(TCGAbiolinks)
> png(filename="/home/ddbj/snapshot/RGM3/R_BC/result/TCGAbiolinks/TCGAVisualize_volcano.Rd_%03d_medium.png", width=480, height=480)
> ### Name: TCGAVisualize_volcano
> ### Title: Creates a volcano plot for DNA methylation or expression
> ### Aliases: TCGAVisualize_volcano
>
> ### ** Examples
>
> x <- runif(200, -1, 1)
> y <- runif(200, 0.01, 1)
> TCGAVisualize_volcano(x,y)
> TCGAVisualize_volcano(x,y,filename = NULL,y.cut = 10000000,x.cut=0.8,
+                       names = rep("AAAA",length(x)), legend = "Status",
+                       names.fill = FALSE)
> TCGAVisualize_volcano(x,y,filename = NULL,y.cut = 10000000,x.cut=0.8,
+                       names = as.character(1:length(x)), legend = "Status",
+                       names.fill = TRUE, highlight = c("1","2"),show="both")
[1] 1 2
> while (!(is.null(dev.list()["RStudioGD"]))){dev.off()}
>
>
>
>
>
> dev.off()
Error in dev.off() : cannot shut down device 1 (the null device)
Execution halted
 .
.