The object to with the heatmap data (expression, methylation)
col.metadata
Metadata for the columns (samples). It should have on of the following columns:
barcode (28 characters) column to match with the samples. It will also work with
"bcr_patient_barcode"(12 chars),"patient"(12 chars),"sample"(16 chars) columns but as one patient might
have more than one sample, this coul lead to errors in the annotation.
The code will throw a warning in case two samples are from the same patient.
row.metadata
Metadata for the rows genes (expression) or probes (methylation)
col.colors
A list of names colors
row.colors
A list of named colors
show_column_names
Show column names names? Dafault: FALSE
show_row_names
Show row names? Dafault: FALSE
cluster_rows
Cluster rows ? Dafault: FALSE
cluster_columns
Cluster columns ? Dafault: FALSE
sortCol
Name of the column to be used to sort the columns
title
Title of the plot
type
Select the colors of the heatmap values. Possible values are
"expression" (default), "methylation"
scale
Use z-score to make the heatmap?
If we want to show differences between genes, it is good to make Z-score by samples
(force each sample to have zero mean and standard deviation=1).
If we want to show differences between samples, it is good to make Z-score by genes
(force each gene to have zero mean and standard deviation=1).
Possibilities: "row", "col". Default "none"
R version 3.3.1 (2016-06-21) -- "Bug in Your Hair"
Copyright (C) 2016 The R Foundation for Statistical Computing
Platform: x86_64-pc-linux-gnu (64-bit)
R is free software and comes with ABSOLUTELY NO WARRANTY.
You are welcome to redistribute it under certain conditions.
Type 'license()' or 'licence()' for distribution details.
R is a collaborative project with many contributors.
Type 'contributors()' for more information and
'citation()' on how to cite R or R packages in publications.
Type 'demo()' for some demos, 'help()' for on-line help, or
'help.start()' for an HTML browser interface to help.
Type 'q()' to quit R.
> library(TCGAbiolinks)
> png(filename="/home/ddbj/snapshot/RGM3/R_BC/result/TCGAbiolinks/TCGAvisualize_Heatmap.Rd_%03d_medium.png", width=480, height=480)
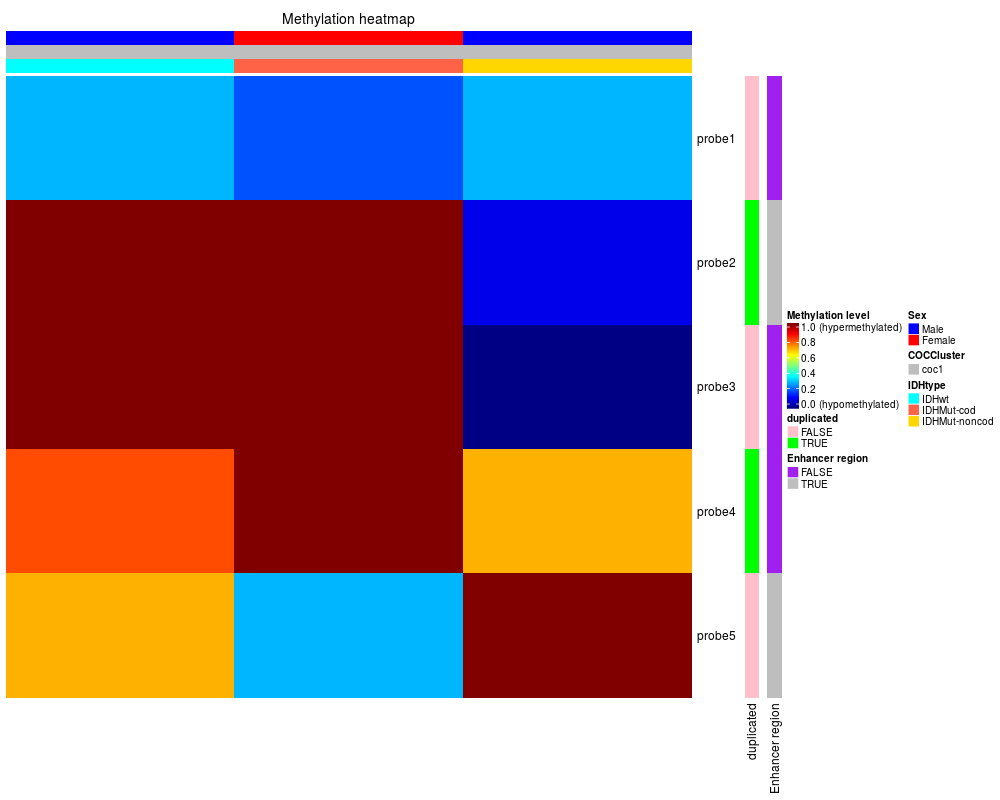
> ### Name: TCGAvisualize_Heatmap
> ### Title: Heatmap with more sensible behavior using heatmap.plus
> ### Aliases: TCGAvisualize_Heatmap
>
> ### ** Examples
>
> row.mdat <- matrix(c("FALSE","FALSE",
+ "TRUE","TRUE",
+ "FALSE","FALSE",
+ "TRUE","FALSE",
+ "FALSE","TRUE"
+ ),
+ nrow = 5, ncol = 2, byrow = TRUE,
+ dimnames = list(
+ c("probe1", "probe2","probe3","probe4","probe5"),
+ c("duplicated", "Enhancer region")))
> dat <- matrix(c(0.3,0.2,0.3,1,1,0.1,1,1,0, 0.8,1,0.7,0.7,0.3,1),
+ nrow = 5, ncol = 3, byrow = TRUE,
+ dimnames = list(
+ c("probe1", "probe2","probe3","probe4","probe5"),
+ c("TCGA-DU-6410",
+ "TCGA-DU-A5TS",
+ "TCGA-HT-7688")))
>
> mdat <- data.frame(patient=c("TCGA-DU-6410","TCGA-DU-A5TS","TCGA-HT-7688"),
+ Sex=c("Male","Female","Male"),
+ COCCluster=c("coc1","coc1","coc1"),
+ IDHtype=c("IDHwt","IDHMut-cod","IDHMut-noncod"))
>
> TCGAvisualize_Heatmap(dat,
+ col.metadata = mdat,
+ row.metadata = row.mdat,
+ row.colors = list(duplicated = c("FALSE" = "pink",
+ "TRUE"="green"),
+ "Enhancer region" = c("FALSE" = "purple",
+ "TRUE"="grey")),
+ col.colors = list(Sex = c("Male" = "blue", "Female"="red"),
+ COCCluster=c("coc1"="grey"),
+ IDHtype=c("IDHwt"="cyan",
+ "IDHMut-cod"="tomato"
+ ,"IDHMut-noncod"="gold")),
+ type = "methylation",
+ show_row_names=TRUE)
Reorganizing: col.metadata order should be the same of the data object
> if (!(is.null(dev.list()["RStudioGD"]))){dev.off()}
null device
1
>
>
>
>
>
> dev.off()
Error in dev.off() : cannot shut down device 1 (the null device)
Execution halted
 .
.