Supported by Dr. Osamu Ogasawara and  . . |
|
Last data update: 2014.03.03 |
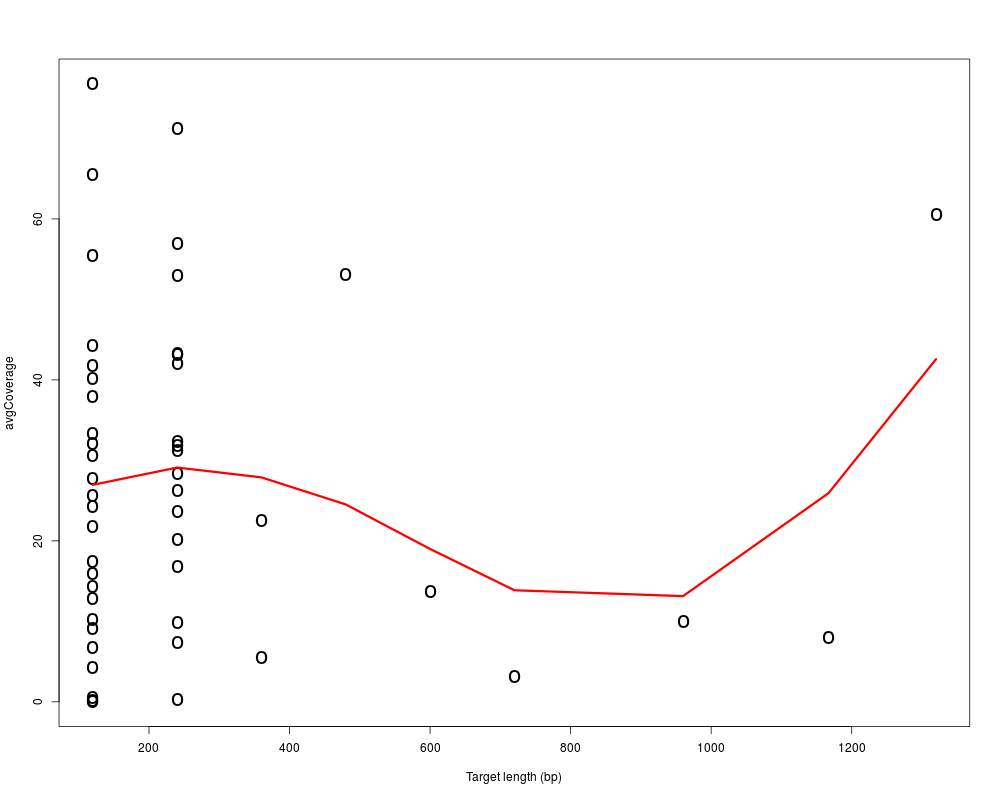
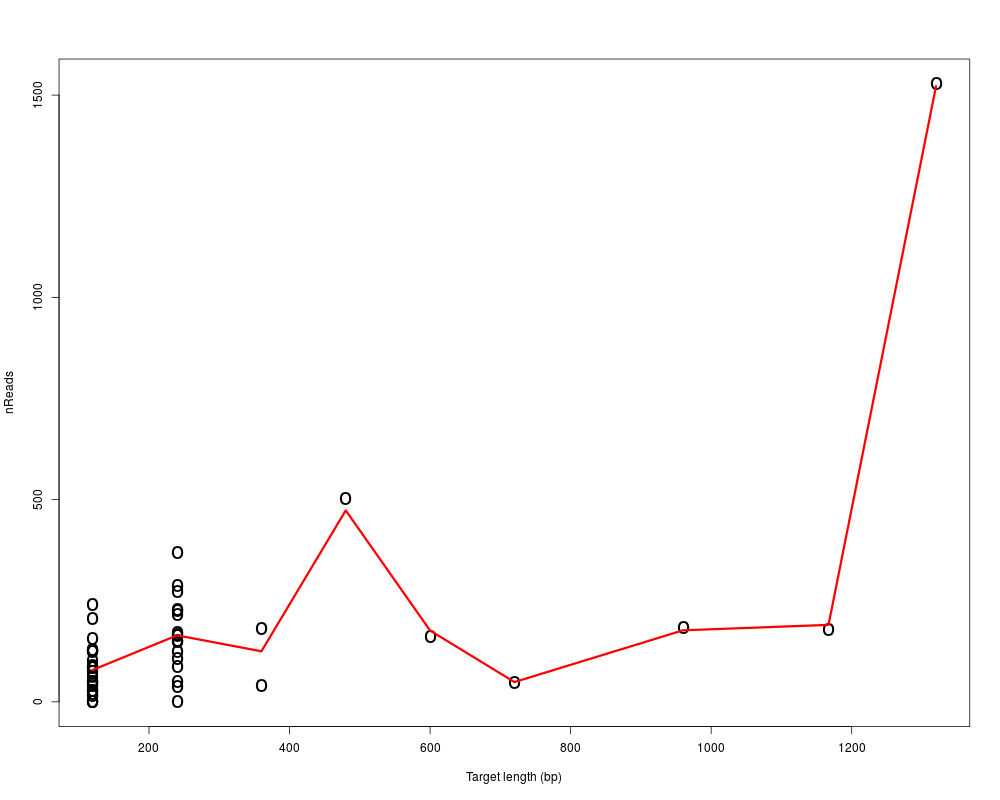
Number of reads or average coverage versus target length scatter plotDescriptionPlots either numbers of on-target reads or average per-target coverage (or potentially other per-target values) against respective target lengths. A smoothing spline is added to the scatter plot. Usagecoverage.targetlength.plot(targets, plotcolumn, linecol = 2, xlab, ylab, lwd, pch, cex, ...) Arguments
Details
ValueA scatterplot with the given per-target values on the y-axis and corresponding target lengths on the x-axis. A smoothing spline is added to the plot. Author(s)Manuela Hummel m.hummel@dkfz.de See Also
Examples
## get reads and targets
exptPath <- system.file("extdata", package="TEQC")
readsfile <- file.path(exptPath, "ExampleSet_Reads.bed")
reads <- get.reads(readsfile, idcol=4, skip=0)
targetsfile <- file.path(exptPath, "ExampleSet_Targets.bed")
targets <- get.targets(targetsfile, skip=0)

## get average per-target coverage
Coverage <- coverage.target(reads, targets, perTarget=TRUE)
targets2 <- Coverage$targetCoverages

## get numbers of reads per target
targets2 <- readsPerTarget(reads, targets2)

## coverage vs target length
coverage.targetlength.plot(targets2, plotcolumn="avgCoverage", pch="o")

## coverage vs number of reads per target
coverage.targetlength.plot(targets2, plotcolumn="nReads", pch="o")
Results
R version 3.3.1 (2016-06-21) -- "Bug in Your Hair"
Copyright (C) 2016 The R Foundation for Statistical Computing
Platform: x86_64-pc-linux-gnu (64-bit)

R is free software and comes with ABSOLUTELY NO WARRANTY.
You are welcome to redistribute it under certain conditions.
Type 'license()' or 'licence()' for distribution details.

R is a collaborative project with many contributors.
Type 'contributors()' for more information and
'citation()' on how to cite R or R packages in publications.

Type 'demo()' for some demos, 'help()' for on-line help, or
'help.start()' for an HTML browser interface to help.
Type 'q()' to quit R.

> library(TEQC)
Loading required package: BiocGenerics
Loading required package: parallel

Attaching package: 'BiocGenerics'

The following objects are masked from 'package:parallel':

    clusterApply, clusterApplyLB, clusterCall, clusterEvalQ,
    clusterExport, clusterMap, parApply, parCapply, parLapply,
    parLapplyLB, parRapply, parSapply, parSapplyLB

The following objects are masked from 'package:stats':

    IQR, mad, xtabs

The following objects are masked from 'package:base':

    Filter, Find, Map, Position, Reduce, anyDuplicated, append,
    as.data.frame, cbind, colnames, do.call, duplicated, eval, evalq,
    get, grep, grepl, intersect, is.unsorted, lapply, lengths, mapply,
    match, mget, order, paste, pmax, pmax.int, pmin, pmin.int, rank,
    rbind, rownames, sapply, setdiff, sort, table, tapply, union,
    unique, unsplit

Loading required package: IRanges
Loading required package: S4Vectors
Loading required package: stats4

Attaching package: 'S4Vectors'

The following objects are masked from 'package:base':

    colMeans, colSums, expand.grid, rowMeans, rowSums

Loading required package: Rsamtools
Loading required package: GenomeInfoDb
Loading required package: GenomicRanges
Loading required package: Biostrings
Loading required package: XVector
Loading required package: hwriter
> png(filename="/home/ddbj/snapshot/RGM3/R_BC/result/TEQC/coverage.targetlength.plot.Rd_%03d_medium.png", width=480, height=480)
> ### Name: coverage.targetlength.plot
> ### Title: Number of reads or average coverage versus target length scatter
> ###   plot
> ### Aliases: coverage.targetlength.plot
> ### Keywords: hplot
>
> ### ** Examples
>
> ## get reads and targets
> exptPath <- system.file("extdata", package="TEQC")
> readsfile <- file.path(exptPath, "ExampleSet_Reads.bed")
> reads <- get.reads(readsfile, idcol=4, skip=0)
[1] "read 19546 sequenced reads"
> targetsfile <- file.path(exptPath, "ExampleSet_Targets.bed")
> targets <- get.targets(targetsfile, skip=0)
[1] "read 50 (non-overlapping) target regions"
Warning message:
the "reduce" method for RangedData object is deprecated
>
> ## get average per-target coverage
> Coverage <- coverage.target(reads, targets, perTarget=TRUE)
> targets2 <- Coverage$targetCoverages
>
> ## get numbers of reads per target
> targets2 <- readsPerTarget(reads, targets2)
>
> ## coverage vs target length
> coverage.targetlength.plot(targets2, plotcolumn="avgCoverage", pch="o")
>
> ## coverage vs number of reads per target
> coverage.targetlength.plot(targets2, plotcolumn="nReads", pch="o")
>
>
>
>
>
> dev.off()
null device
          1
>
|