Supported by Dr. Osamu Ogasawara and  . . |
|
Last data update: 2014.03.03 |
Read duplicates barplotDescriptionBarplot showing fractions of reads / read pairs which are unique and for which there are two, three, ... copies. Separate bars are made for on- and off-target reads / read pairs Usage
duplicates.barplot(reads, targets, returnDups=FALSE, truncateX, col=c("red","lightblue"), xlab, ylab, ylim, ...)
Arguments
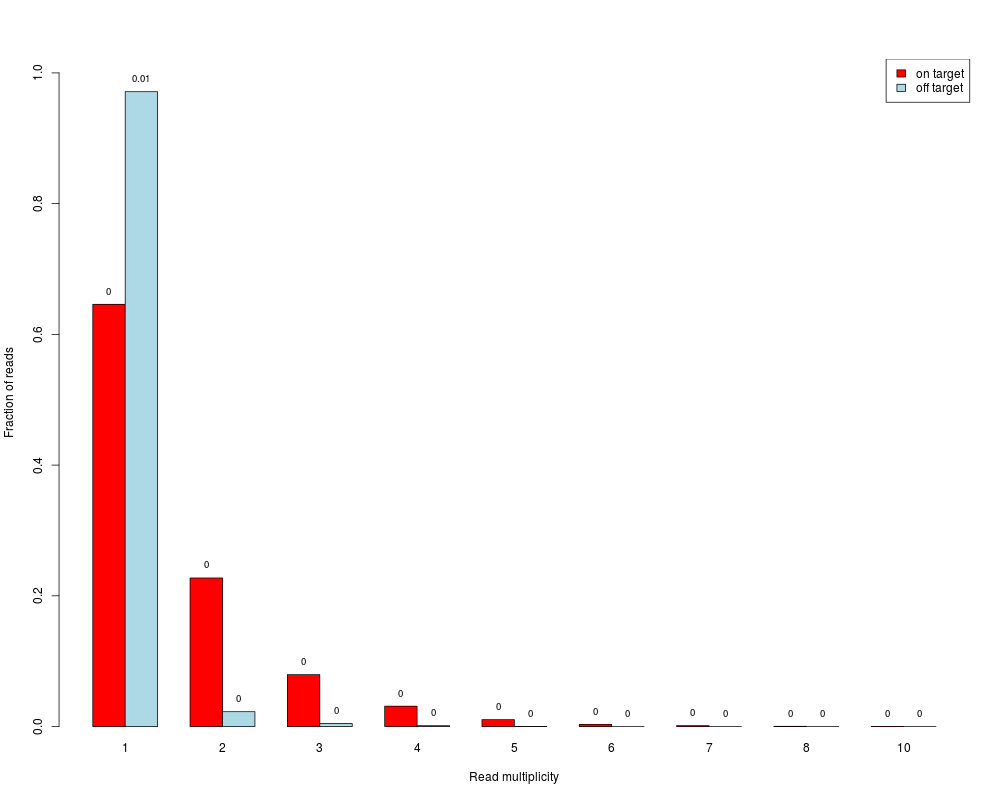
DetailsSingle-end reads are considered as duplicates if they have same start end end position. Paired-end read pairs are considered as duplicates if start and end positions of both reads of the pairs are identical. Usually, duplicates are removed before further analyses (e.g. SNP detection), because they could represent PCR artefacts. However, in target capture experiments it is likely to have also many "real" duplicates (actual different molecules that happen to start at same position) due to the "enrichment" of the target regions. The separation in the barplot between on- and off-target reads / read pairs gives an impression on whether on-target there are more reads with higher multiplicites, which hence might indicate a reasonable amount of "real" duplication. A paired-end read pair is considered on-target if at least one of its reads overlaps with a target. ValueBarplot where the bar heights correspond to fractions of reads / read pairs which are present in the data with the respective number of copies (x-axis). Fractions are calculated separately for on- and off-target reads / read pairs. A read pair is considered on-target if at least one of its reads overlaps with a target. Absolute numbers (in millions) are additionally written on top of the bars. If Author(s)Manuela Hummel m.hummel@dkfz.de See Also
Examples
## get reads and targets
exptPath <- system.file("extdata", package="TEQC")
readsfile <- file.path(exptPath, "ExampleSet_Reads.bed")
reads <- get.reads(readsfile, idcol=4, skip=0)
targetsfile <- file.path(exptPath, "ExampleSet_Targets.bed")
targets <- get.targets(targetsfile, skip=0)

## duplicates barplot for single reads
duplicates.barplot(reads, targets, returnDups=TRUE)

## duplicates barplot for read pairs
readpairs <- reads2pairs(reads)
duplicates.barplot(readpairs, targets, returnDups=TRUE)
Results
R version 3.3.1 (2016-06-21) -- "Bug in Your Hair"
Copyright (C) 2016 The R Foundation for Statistical Computing
Platform: x86_64-pc-linux-gnu (64-bit)
R is free software and comes with ABSOLUTELY NO WARRANTY.
You are welcome to redistribute it under certain conditions.
Type 'license()' or 'licence()' for distribution details.
R is a collaborative project with many contributors.
Type 'contributors()' for more information and
'citation()' on how to cite R or R packages in publications.
Type 'demo()' for some demos, 'help()' for on-line help, or
'help.start()' for an HTML browser interface to help.
Type 'q()' to quit R.
> library(TEQC)
Loading required package: BiocGenerics
Loading required package: parallel
Attaching package: 'BiocGenerics'
The following objects are masked from 'package:parallel':
clusterApply, clusterApplyLB, clusterCall, clusterEvalQ,
clusterExport, clusterMap, parApply, parCapply, parLapply,
parLapplyLB, parRapply, parSapply, parSapplyLB
The following objects are masked from 'package:stats':
IQR, mad, xtabs
The following objects are masked from 'package:base':
Filter, Find, Map, Position, Reduce, anyDuplicated, append,
as.data.frame, cbind, colnames, do.call, duplicated, eval, evalq,
get, grep, grepl, intersect, is.unsorted, lapply, lengths, mapply,
match, mget, order, paste, pmax, pmax.int, pmin, pmin.int, rank,
rbind, rownames, sapply, setdiff, sort, table, tapply, union,
unique, unsplit
Loading required package: IRanges
Loading required package: S4Vectors
Loading required package: stats4
Attaching package: 'S4Vectors'
The following objects are masked from 'package:base':
colMeans, colSums, expand.grid, rowMeans, rowSums
Loading required package: Rsamtools
Loading required package: GenomeInfoDb
Loading required package: GenomicRanges
Loading required package: Biostrings
Loading required package: XVector
Loading required package: hwriter
> png(filename="/home/ddbj/snapshot/RGM3/R_BC/result/TEQC/duplicates.barplot.Rd_%03d_medium.png", width=480, height=480)
> ### Name: duplicates.barplot
> ### Title: Read duplicates barplot
> ### Aliases: duplicates.barplot
> ### Keywords: hplot
>
> ### ** Examples
>
> ## get reads and targets
> exptPath <- system.file("extdata", package="TEQC")
> readsfile <- file.path(exptPath, "ExampleSet_Reads.bed")
> reads <- get.reads(readsfile, idcol=4, skip=0)
[1] "read 19546 sequenced reads"
> targetsfile <- file.path(exptPath, "ExampleSet_Targets.bed")
> targets <- get.targets(targetsfile, skip=0)
[1] "read 50 (non-overlapping) target regions"
Warning message:
the "reduce" method for RangedData object is deprecated
>
> ## duplicates barplot for single reads
> duplicates.barplot(reads, targets, returnDups=TRUE)
$absolute
1 2 3 4 5 6 7 8 10
on target 3166 1114 390 153 52 16 7 2 1
off target 11184 262 52 15 3 0 0 0 0
$relative
1 2 3 4 5 6
on target 0.6459906 0.22730055 0.079575597 0.031218119 0.0106100796 0.00326464
off target 0.9711705 0.02275096 0.004515457 0.001302536 0.0002605071 0.00000000
7 8 10
on target 0.00142828 0.00040808 0.00020404
off target 0.00000000 0.00000000 0.00000000
>
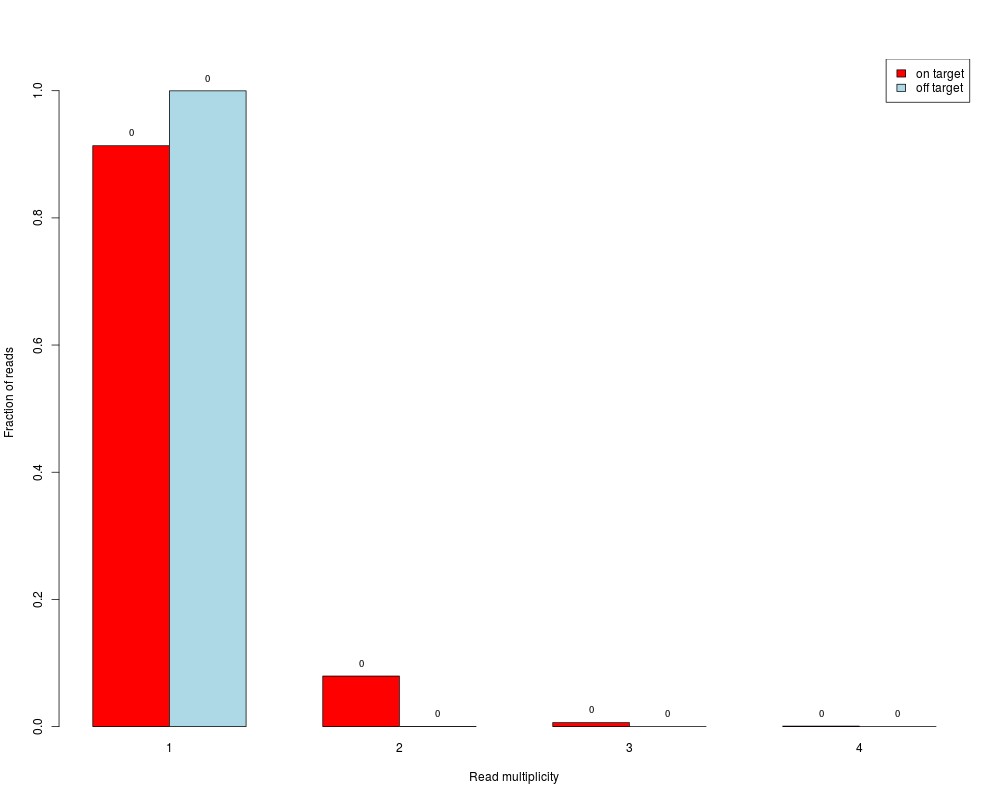
> ## duplicates barplot for read pairs
> readpairs <- reads2pairs(reads)
> duplicates.barplot(readpairs, targets, returnDups=TRUE)
$absolute
1 2 3 4
on target 4026 350 28 3
off target 4949 1 0 0
$relative
1 2 3 4
on target 0.9135466 0.0794191060 0.006353528 0.0006807352
off target 0.9997980 0.0002020202 0.000000000 0.0000000000
>
>
>
>
>
> dev.off()
null device
1
>
|