Node scaling coefficient
(based on node frequency). Default NA (autoscale)
title
Title of the plot. Default as.description(x)
confidence
Should I add confidence
informations? No if NA
p.min
p-value cutoff. Default automatic
legend
Should I visualise the legend?
legend.cex
CEX value for legend. Default 1.0
edge.cex
CEX value for edge labels. Default 1.0
label.edge.size
Size of edge labels.
Default NA for automatic rescaling
expand
Should I expand hypotheses? Default TRUE
genes
Visualise only genes in this list.
Default NULL, visualise all.
relations.filter
Filter relations to dispaly
according to this functions. Default NA
edge.color
Edge color. Default 'black'
pathways.color
RColorBrewer colorser
for patways. Default 'Set1'.
file
String containing filename for PDF output.
If NA no PDF output will be provided
legend.pos
Legend position. Default 'bottom',
pathways
A vector containing pathways information
as described in as.patterns()
lwd
Edge base lwd. Default 3
samples.annotation
= List of samples to search
for events in model
export.igraph
If TRUE export the igraph
object generated
...
Additional arguments for RGraphviz
plot function
Value
Information about the reconstructed model
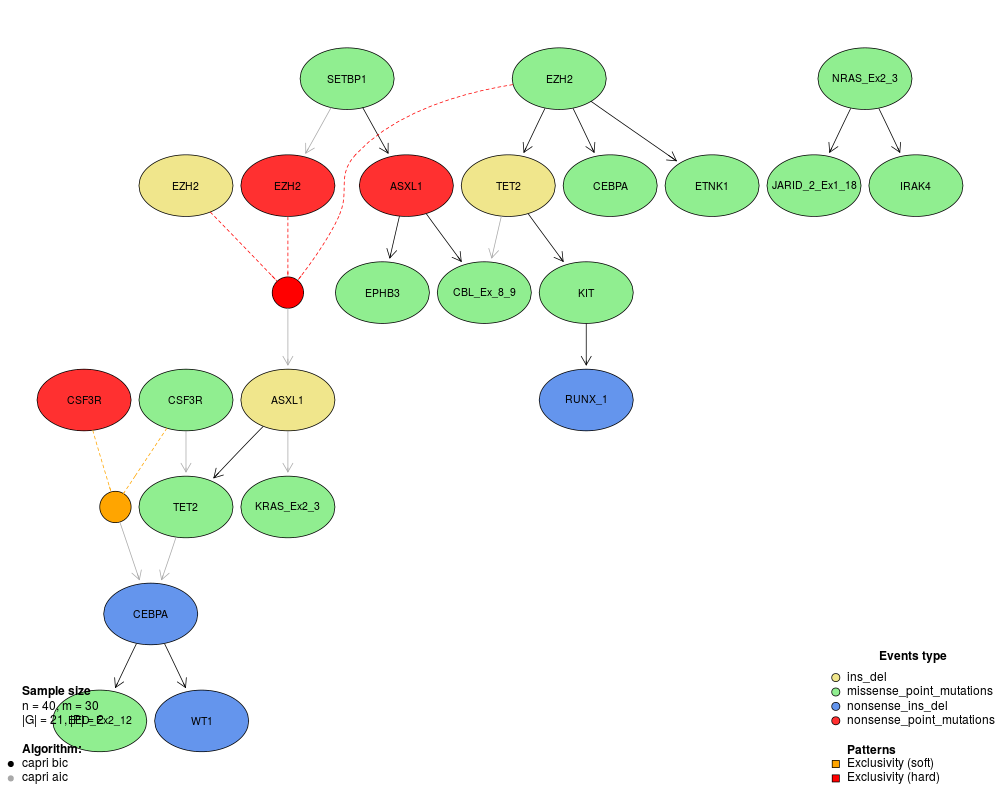
Examples
data(test_model)
tronco.plot(test_model)
Results
R version 3.3.1 (2016-06-21) -- "Bug in Your Hair"
Copyright (C) 2016 The R Foundation for Statistical Computing
Platform: x86_64-pc-linux-gnu (64-bit)

R is free software and comes with ABSOLUTELY NO WARRANTY.
You are welcome to redistribute it under certain conditions.
Type 'license()' or 'licence()' for distribution details.

R is a collaborative project with many contributors.
Type 'contributors()' for more information and
'citation()' on how to cite R or R packages in publications.

Type 'demo()' for some demos, 'help()' for on-line help, or
'help.start()' for an HTML browser interface to help.
Type 'q()' to quit R.

> library(TRONCO)
> png(filename="/home/ddbj/snapshot/RGM3/R_BC/result/TRONCO/tronco.plot.Rd_%03d_medium.png", width=480, height=480)
> ### Name: tronco.plot
> ### Title: tronco.plot
> ### Aliases: tronco.plot
>
> ### ** Examples
>
> data(test_model)
> tronco.plot(test_model)
*** Expanding hypotheses syntax as graph nodes:
*** Rendering graphics
Nodes with no incoming/outgoing edges will not be displayed.
RGraphviz object prepared.
Plotting graph and adding legends.

>
>
>
>
>
>
> dev.off()
null device
          1
>
 .
.