Supported by Dr. Osamu Ogasawara and  . . |
|
Last data update: 2014.03.03 |
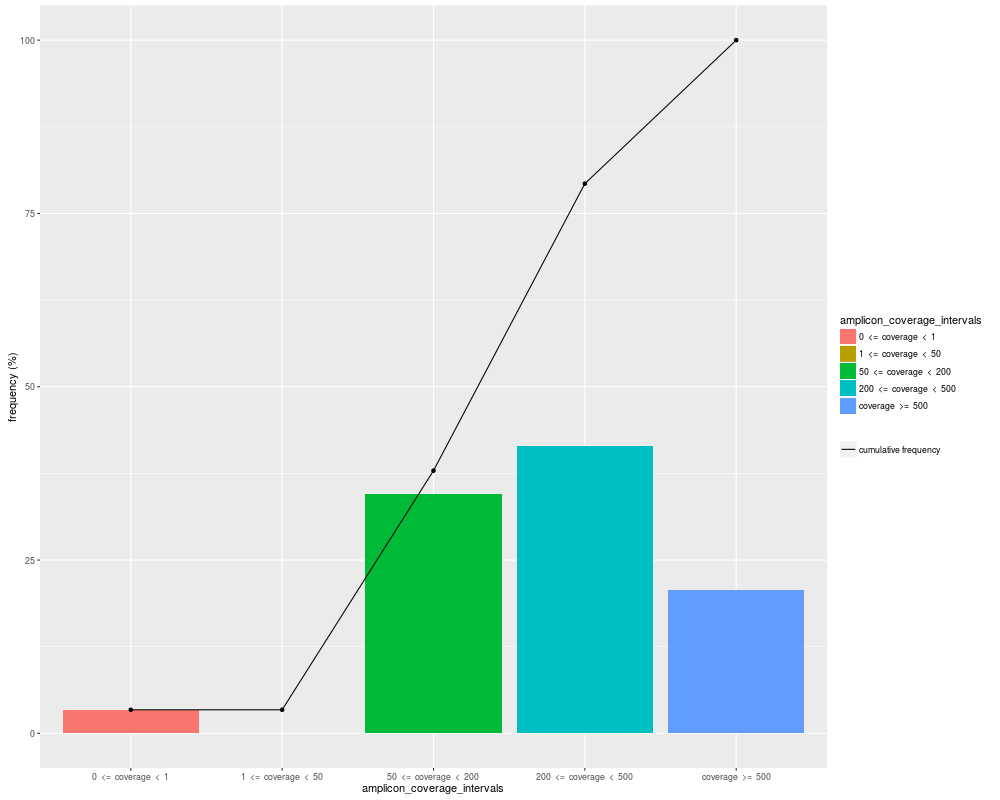
Plot feature performance of a TargetExperiment object.Description
Usage
plotAttrPerform(object, attributeThres = c(0, 1, 50, 200, 500, Inf))

## S4 method for signature 'TargetExperiment'
plotAttrPerform(object, attributeThres = c(0, 1,
    50, 200, 500, Inf))
Arguments
Valueggplot2 graphics Notesee full example in Author(s)Gabriela A. Merino gmerino@bdmg.com.ar, Cristobal Fresno cfresno@bdmg.com.ar and Elmer A. Fernandez efernandez@bdmg.com.ar See Also
Examples
## Loading the TargetExperiment object
data(ampliPanel, package="TarSeqQC")

# Definition of the interval extreme values
attributeThres<-c(0,1,50,200,500, Inf)

# Plot panel overview in a feature performance plot
g<-plotAttrPerform(ampliPanel, attributeThres=attributeThres)
if(interactive()){
g
}
Results
R version 3.3.1 (2016-06-21) -- "Bug in Your Hair"
Copyright (C) 2016 The R Foundation for Statistical Computing
Platform: x86_64-pc-linux-gnu (64-bit)

R is free software and comes with ABSOLUTELY NO WARRANTY.
You are welcome to redistribute it under certain conditions.
Type 'license()' or 'licence()' for distribution details.

R is a collaborative project with many contributors.
Type 'contributors()' for more information and
'citation()' on how to cite R or R packages in publications.

Type 'demo()' for some demos, 'help()' for on-line help, or
'help.start()' for an HTML browser interface to help.
Type 'q()' to quit R.

> library(TarSeqQC)
Loading required package: GenomicRanges
Loading required package: BiocGenerics
Loading required package: parallel

Attaching package: 'BiocGenerics'

The following objects are masked from 'package:parallel':

    clusterApply, clusterApplyLB, clusterCall, clusterEvalQ,
    clusterExport, clusterMap, parApply, parCapply, parLapply,
    parLapplyLB, parRapply, parSapply, parSapplyLB

The following objects are masked from 'package:stats':

    IQR, mad, xtabs

The following objects are masked from 'package:base':

    Filter, Find, Map, Position, Reduce, anyDuplicated, append,
    as.data.frame, cbind, colnames, do.call, duplicated, eval, evalq,
    get, grep, grepl, intersect, is.unsorted, lapply, lengths, mapply,
    match, mget, order, paste, pmax, pmax.int, pmin, pmin.int, rank,
    rbind, rownames, sapply, setdiff, sort, table, tapply, union,
    unique, unsplit

Loading required package: S4Vectors
Loading required package: stats4

Attaching package: 'S4Vectors'

The following objects are masked from 'package:base':

    colMeans, colSums, expand.grid, rowMeans, rowSums

Loading required package: IRanges
Loading required package: GenomeInfoDb
Loading required package: Rsamtools
Loading required package: Biostrings
Loading required package: XVector
Loading required package: ggplot2
Loading required package: plyr

Attaching package: 'plyr'

The following object is masked from 'package:XVector':

    compact

The following object is masked from 'package:IRanges':

    desc

The following object is masked from 'package:S4Vectors':

    rename

Loading required package: openxlsx
> png(filename="/home/ddbj/snapshot/RGM3/R_BC/result/TarSeqQC/TargetExperiment-plotAttrPerform.Rd_%03d_medium.png", width=480, height=480)
> ### Name: plotAttrPerform
> ### Title: Plot feature performance of a TargetExperiment object.
> ### Aliases: plotAttrPerform plotAttrPerform,TargetExperiment-method
> ###   plotAttrPerform-methods
>
> ### ** Examples
>
> ## Loading the TargetExperiment object
> data(ampliPanel, package="TarSeqQC")
>
> # Definition of the interval extreme values
> attributeThres<-c(0,1,50,200,500, Inf)
>
> # Plot panel overview in a feature performance plot
> g<-plotAttrPerform(ampliPanel, attributeThres=attributeThres)
> #if(interactive()){
> g
> #}
>
>
>
>
>
> dev.off()
null device
          1
>
|
Created & Maintained by Osamu Ogasawara (osamu.ogasawara@gmail.com) and 